

Question: Please help me solve this. I need to show the work and the plot. The table below displays the ages on the ceremony of the
Please help me solve this. I need to show the work and the plot.
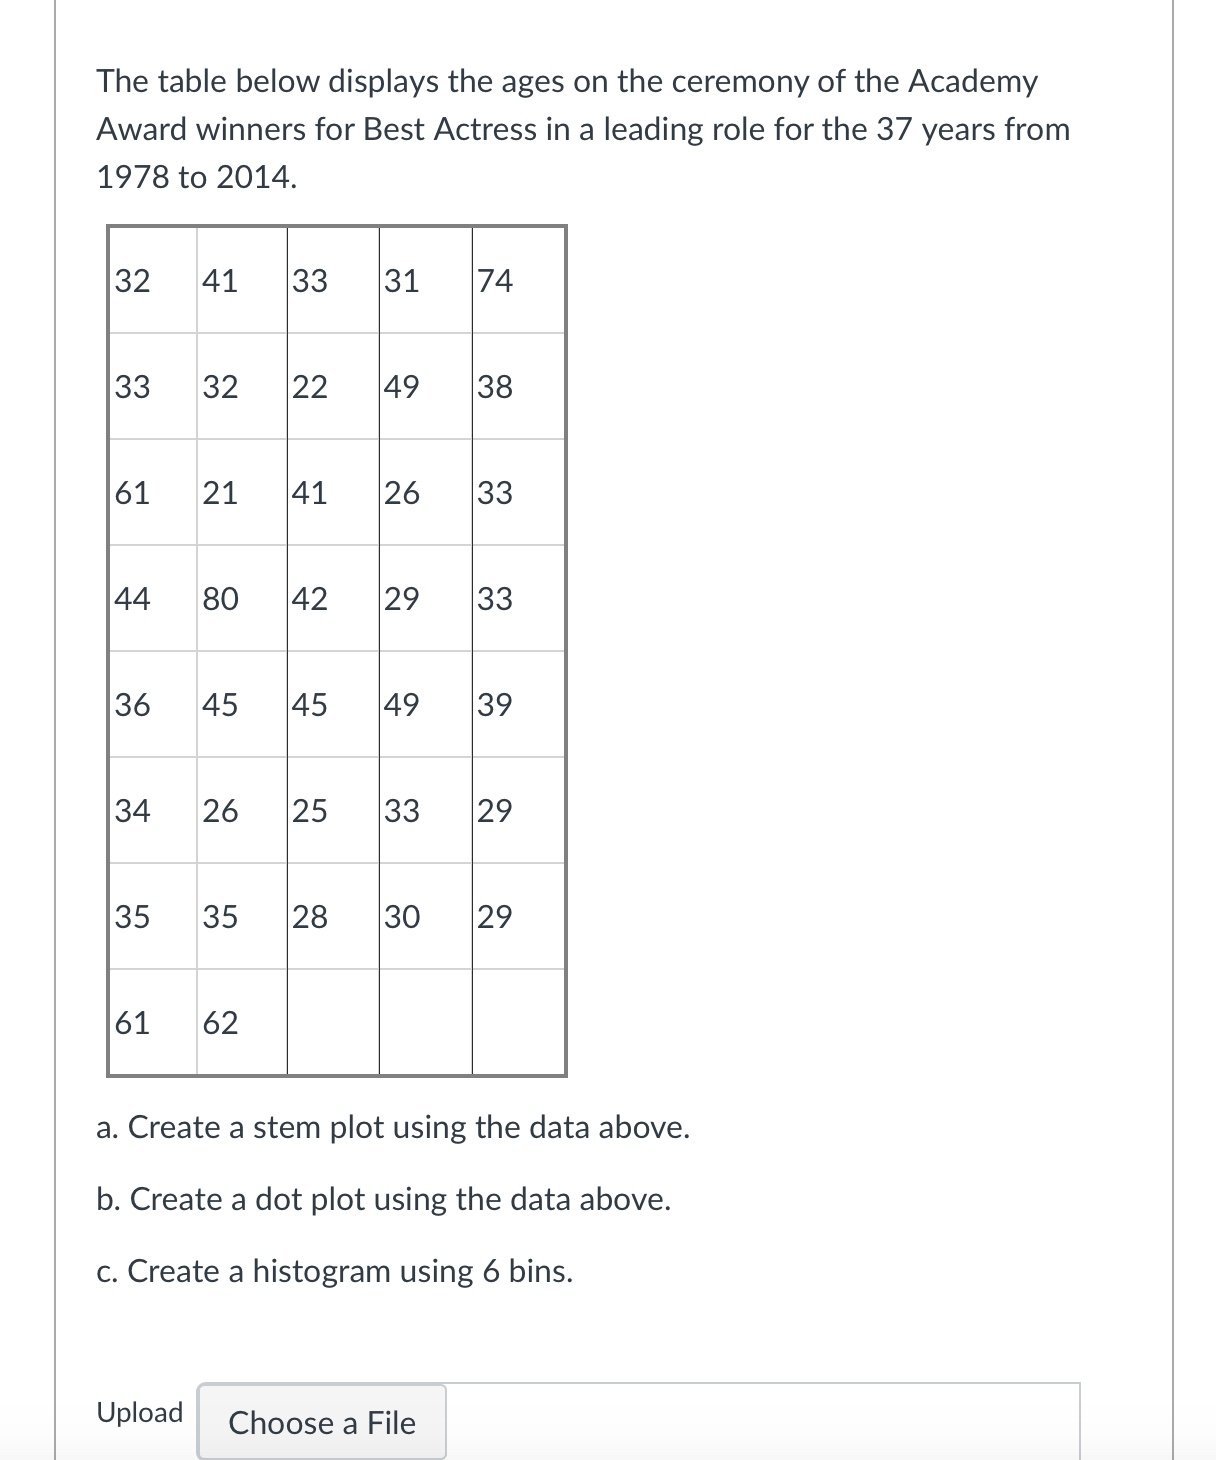
The table below displays the ages on the ceremony of the Academy Award winners for Best Actress in a leading role for the 37 years from 1978 to 2014. a. Create a stem plot using the data above. b. Create a dot plot using the data above. c. Create a histogram using 6 bins. Upload Choose a File &
Step by Step Solution
There are 3 Steps involved in it
1 Expert Approved Answer
Step: 1 Unlock

Question Has Been Solved by an Expert!
Get step-by-step solutions from verified subject matter experts
Step: 2 Unlock
Step: 3 Unlock