

Question: Please help me solve this in Excel step by step and how to do the graphic! Thank you! Wiebe Trucking, Inc., is planning a new
Please help me solve this in Excel step by step and how to do the graphic! Thank you!
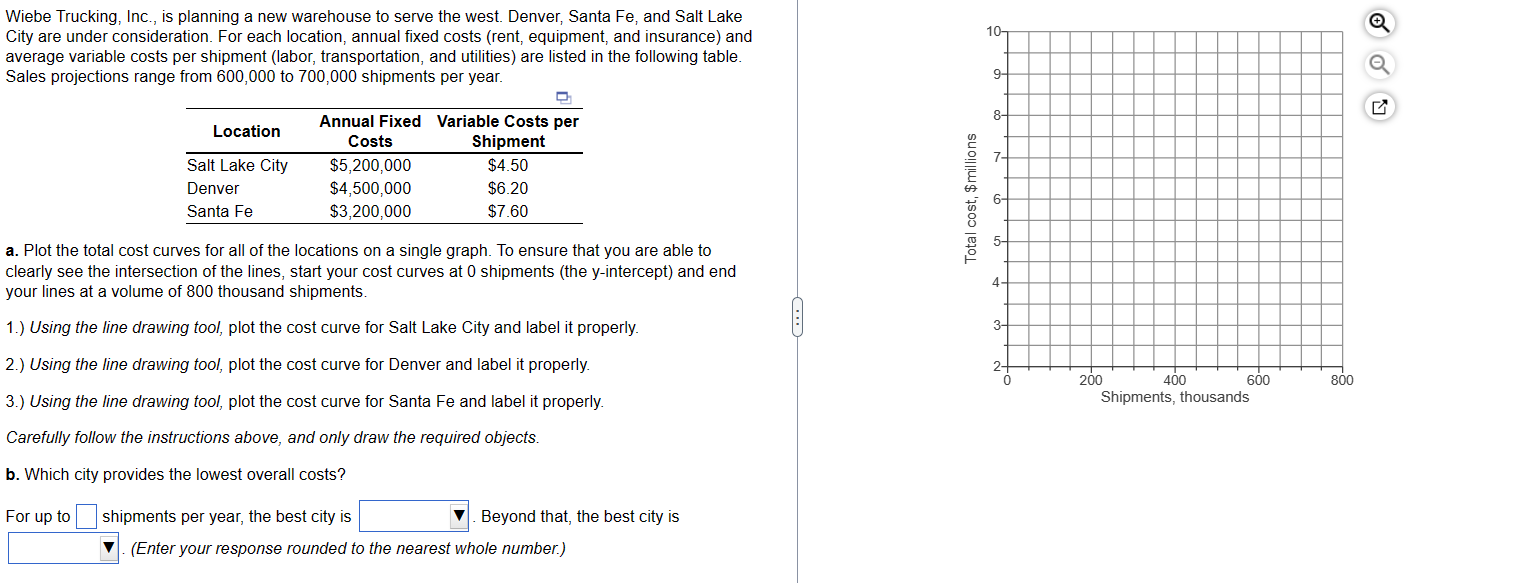
Wiebe Trucking, Inc., is planning a new warehouse to serve the west. Denver, Santa Fe, and Salt Lake City are under consideration. For each location, annual fixed costs (rent, equipment, and insurance) and average variable costs per shipment (labor, transportation, and utilities) are listed in the following table. Sales projections range from 600,000 to 700,000 shipments per year. a. Plot the total cost curves for all of the locations on a single graph. To ensure that you are able to clearly see the intersection of the lines, start your cost curves at 0 shipments (the y-intercept) and end your lines at a volume of 800 thousand shipments. 1.) Using the line drawing tool, plot the cost curve for Salt Lake City and label it properly. 2.) Using the line drawing tool, plot the cost curve for Denver and label it properly. 3.) Using the line drawing tool, plot the cost curve for Santa Fe and label it properly. Carefully follow the instructions above, and only draw the required objects. b. Which city provides the lowest overall costs? For up to shipments per year, the best city is Beyond that, the best city is (Enter your response rounded to the nearest whole number.)
Step by Step Solution
There are 3 Steps involved in it

Get step-by-step solutions from verified subject matter experts