

Question: please help me solve this on excel based on the images attacthed. Capital Allocation Lines: Assume that the mean return, standard deviation, and correlation estimates
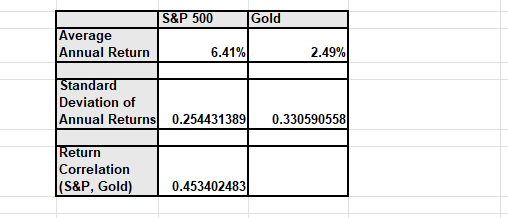
please help me solve this on excel based on the images attacthed. Capital Allocation Lines: Assume that the mean return, standard deviation, and correlation estimates you calculated above provide a reasonable forecast of the expected returns and risks of these securities for the coming year. Based on these forecasts, plot the two risky securities on an expected return standard deviation graph. Also, plot the riskfree security. Be sure to label all three securities on the graph. Draw the Capital Allocation Line for each of the risky securities S&P and Gold Attach the graph as Exhibit
Step by Step Solution
There are 3 Steps involved in it
1 Expert Approved Answer
Step: 1 Unlock

Question Has Been Solved by an Expert!
Get step-by-step solutions from verified subject matter experts
Step: 2 Unlock
Step: 3 Unlock