

Question: Please help me solve this question. All the data you need is in the attached picture. Question 4 (Value of 2) The table below shows
Please help me solve this question. All the data you need is in the attached picture.
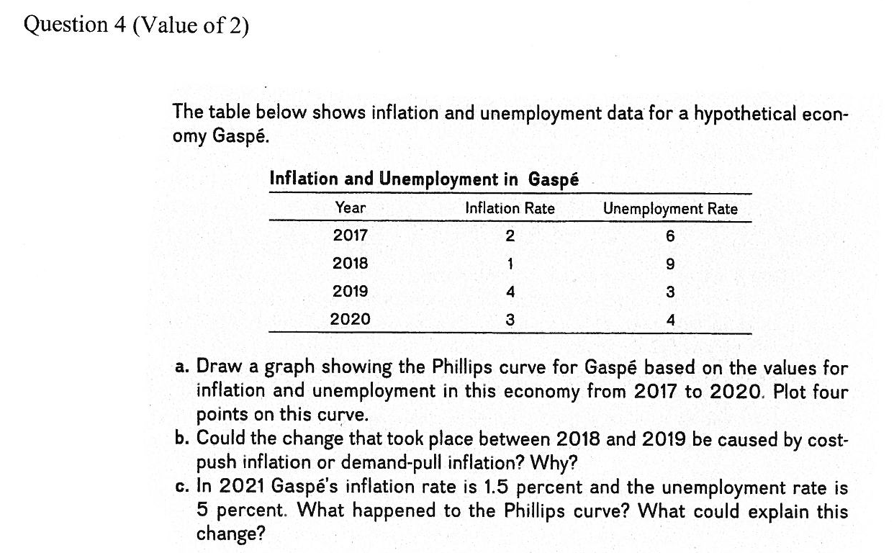
Question 4 (Value of 2) The table below shows inflation and unemployment data for a hypothetical econ- omy Gasp. Inflation and Unemployment in Basp Year Inflation Rate Unemployment Rate 2017 2 '5 2018 1 9 2019 4 3 2020 3 4 3. Draw a graph showing the Phillips curve for Gasp based on the values for inflation and unemployment in this economy from 2017 to 2020. Plot four points on this curve. b. Could the change that took place between 2018 and 2019 be caused by cost- push inflation or demand-pull inflation? Why? c. In 2021 Gasp's inflation rate is 1.5 percent and the unemployment rate is 5 percent. What happened to the Phillips curve? What could explain this change
Step by Step Solution
There are 3 Steps involved in it

Get step-by-step solutions from verified subject matter experts