

Question: please help me solve this question i have attached all the required screenshot. S T M P R On this problem, you can use either
please help me solve this question i have attached all the required screenshot. 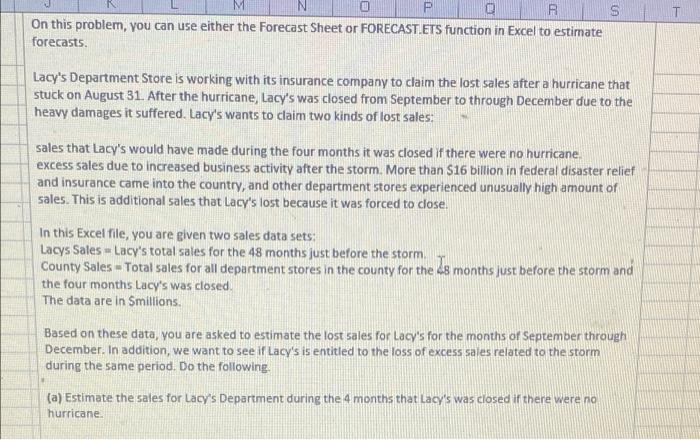
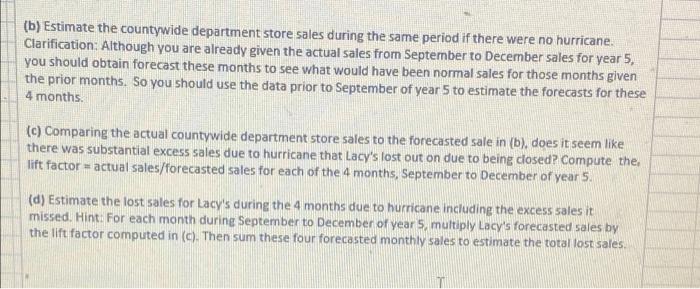
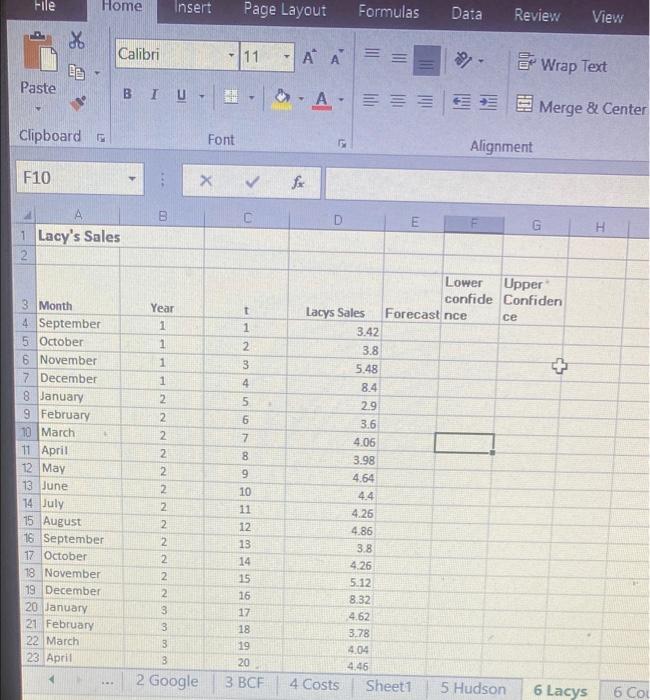
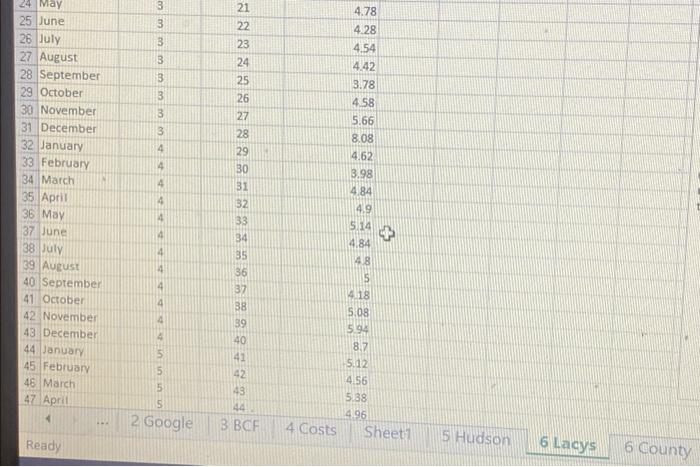
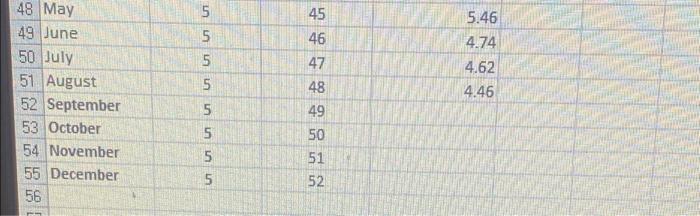
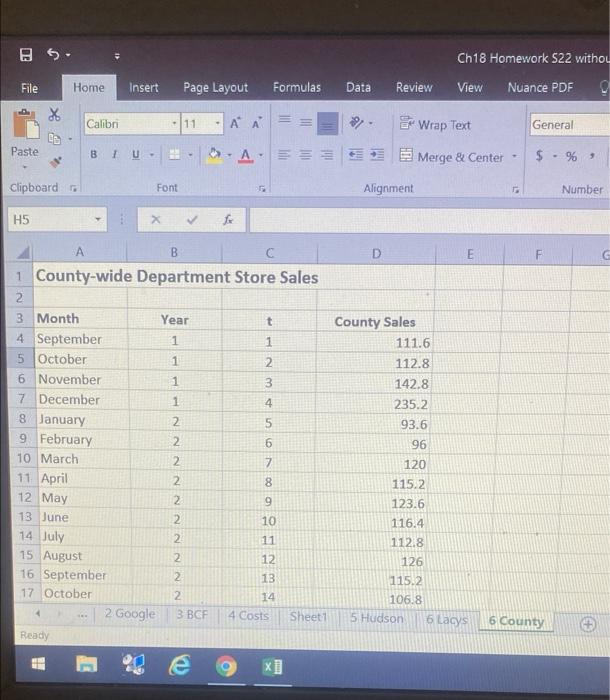
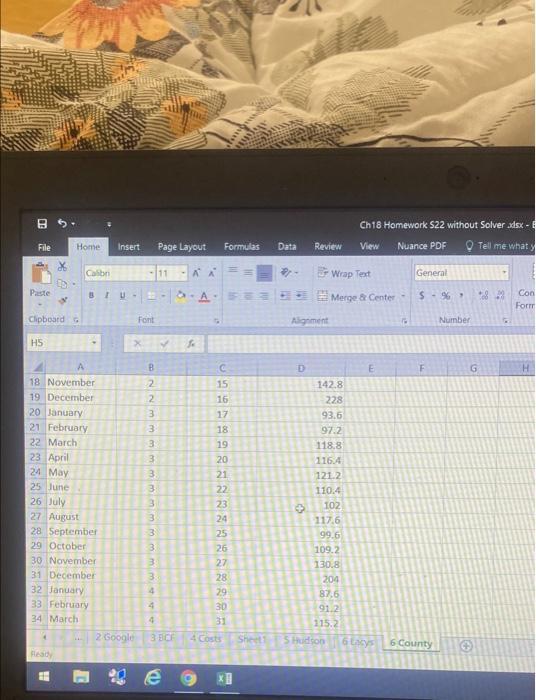
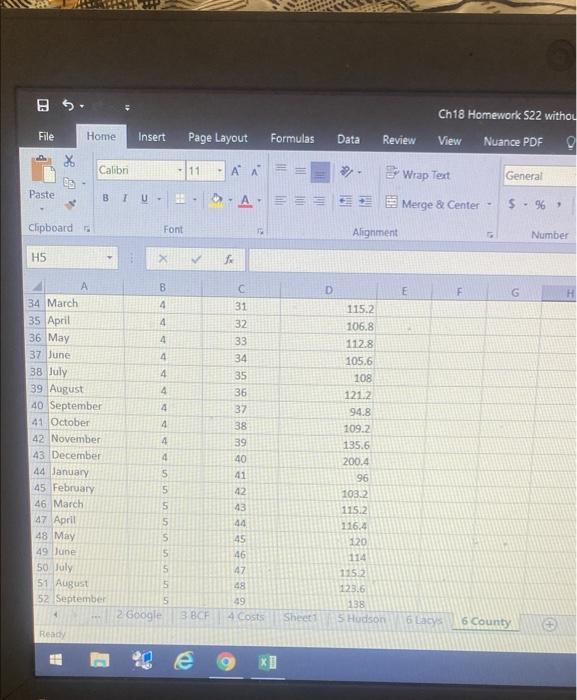
S T M P R On this problem, you can use either the Forecast Sheet or FORECAST.ETS function in Excel to estimate forecasts. Lacy's Department Store is working with its insurance company to claim the lost sales after a hurricane that stuck on August 31. After the hurricane, Lacy's was closed from September to through December due to the heavy damages it suffered. Lacy's wants to claim two kinds of lost sales: sales that Lacy's would have made during the four months it was closed if there were no hurricane excess sales due to increased business activity after the storm. More than $16 billion in federal disaster relief and insurance came into the country, and other department stores experienced unusually high amount of sales. This is additional sales that Lacy's lost because it was forced to close. In this Excel file, you are given two sales data sets: Lacys Sales - Lacy's total sales for the 48 months just before the storm County Sales - Total sales for all department stores in the county for the 28 months just before the storm and the four months Lacy's was closed. The data are in Smillions. Based on these data, you are asked to estimate the lost sales for Lacy's for the months of September through December. In addition, we want to see if Lacy's is entitled to the loss of excess sales related to the storm during the same period. Do the following (a) Estimate the sales for Lacy's Department during the 4 months that Lacy's was closed if there were no hurricane (b) Estimate the countywide department store sales during the same period if there were no hurricane. Clarification: Although you are already given the actual sales from September to December sales for year 5, you should obtain forecast these months to see what would have been normal sales for those months given the prior months. So you should use the data prior to September of year 5 to estimate the forecasts for these 4 months (c) Comparing the actual countywide department store sales to the forecasted sale in (b), does it seem like there was substantial excess sales due to hurricane that Lacy's lost out on due to being closed? Compute the. lift factor - actual sales/forecasted sales for each of the 4 months, September to December of year 5. (d) Estimate the lost sales for Lacy's during the 4 months due to hurricane including the excess sales it missed. Hint: For each month during September to December of year 5, multiply Lacy's forecasted sales by the lift factor computed in (c). Then sum these four forecasted monthly sales to estimate the total lost sales. File Home Insert Page Layout Formulas Data Review View X Calibri 11 Wrap Text Paste -A Merge & Center Clipboard Font 5 Alignment F10 > B C E 1 Lacy's Sales 2 Lower Upper confide Confiden Forecast nce Year 1 1 t 1 2 3 4 AN Lacys Sales 3.42 3.8 5.48 8.4 1 + 1 5 2 2 29 2 2 2 6 7 8 3 Month 4 September 5. October 6 November 7 December 8 January 9 February 10 March 11 April 12 May 13 June 14 July 15 August 16 September 17 October 18 November 19 December 20 January 21 February 22 March 23 April 9 3.6 4.06 3.98 4.64 NNNNNN 10 11 4.4 2 2 2 2 2 2 2 3 3 3 3 12 13 14 15 16 17 18 19 20 3 BCF 4.26 4.86 3.8 4.26 5.12 8.32 4.62 3.78 4.04 4.46 4 Costs Sheet1 2 Google 5 Hudson 6 Lacys 6 Col 3 3 3 3 3 3 3 3 4 4 24 May 25 June 26 July 27 August 28 September 29 October 30 November 31 December 32 January 33 February 34 March 35 April 36 May 37 June 38 July 39 August 40 September 41 October 42 November 43 December 44 January 45 February 46 March 47 April 4 4 21 22 23 24 25 26 27 28 29 30 3 32 33 34 35 36 37 38 39 40 41 4 4.78 4.28 4.54 4.42 3.78 4.58 5,66 8.08 4.62 3.98 484 4.9 5.14 + 4.84 18 5 418 5.08 5.94 8.2 5.12 4.56 5.38 496 4 Costs Sheet1 4 4 4 4 4 5 5 5 5 un 42 43 44 3 BCF 2 Google 5 Hudson Ready 6.Lasys 6 County 5 5 5 5 48 May 49 June 50 July 51 August 52 September 53 October 54 November 55 December 56 45 46 47 48 49 50 51 52 5.46 4.74 4.62 4.46 5 5 5 5. Ch18 Homework S22 withou File Home Insert Page Layout Formulas Data Review View Nuance PDF g X Calibri +11 -A A General Et Wrap Text Merge & Center Paste BIU. $ - % Clipboard Font Alignment Number H5 E F B D 1 County-wide Department Store Sales 2 3 Month Year t County Sales 4 September 1 1 111.6 5 October 1 2 112.8 6 November 1 3 142.8 7 December 1 4 235.2 8 January 2 5 93.6 9 February 2 6 10 March 2 7 120 11 April 2 8 115.2 12 May 2 9 123.6 13 June 2 10 116.4 14 July 2 11 112.8 15 August 2 12 126 16 September 2 13 115.2 17 October 2 14 106.8 2 Google 3 BCF 4 Costs Sheet1 5 Hudson Ready 96 00 2 N NN 6 Lacy 6 County x] Ch18 Homework S22 without Solver disx- View Nuance PDF Tell me what File Home Insert Page Layout Formulas Data Review Colon -11 Wrap Text General Paste A. Merge & Center - S - % *82 Cod Form Clipboard Font Alignment Number HS G H B 2 2 3 3 3 3 3 3 3 18 November 19 December 20 January 21 February 22 March 23 April 24 May 25 June 26 July 27 August 28 September 29 October 30 November 31 December 32 January 33 February 34 March 2.Google Head 15 16 17 18 19 20 21 22 23 24 25 26 27 28 79 30 31 D E 142,8 228 93.5 97.2 118.8 116.4 121.2 110.4 102 117.6 99.6 109.2 130.8 204 87.6 91.2 115.2 She S Hudson 6 tacy 3 3 3 3 3 4 4 4 380 4 Costs 6 County EF Ch18 Homework S22 withou File Home Insert Page Layout Formulas Data Review View Nuance PDF g Calibri -111 A General Wrap Text * E Merge & Center Paste BIU > A== $. 96 Clipboard Font Alignment Number HS X V ri 00 D E F G 4 31 4 4 4 4 4 32 33 34 35 36 37 38 34 March 35 April 36 May 37 June 38 July 39 August 40 September 41 October 42 November 43 December 44 January 45 February 46 March 47 April 48 May 49 June 50 July 51 August 52 September 4 4 4 39 4 5 115.2 106.8 112.8 105.6 108 121.2 94.8 109.2 135.6 200.4 96 1032 115.2 116.4 120 114 115.2 123.6 138 5 Hudson 40 41 42 43 44 5 5 5 S 666GSURE 5 5 45 146 47 48 5 5 2 Google 49 4 COSTS Sheet 6 Lacy 6 County Red 9 S T M P R On this problem, you can use either the Forecast Sheet or FORECAST.ETS function in Excel to estimate forecasts. Lacy's Department Store is working with its insurance company to claim the lost sales after a hurricane that stuck on August 31. After the hurricane, Lacy's was closed from September to through December due to the heavy damages it suffered. Lacy's wants to claim two kinds of lost sales: sales that Lacy's would have made during the four months it was closed if there were no hurricane excess sales due to increased business activity after the storm. More than $16 billion in federal disaster relief and insurance came into the country, and other department stores experienced unusually high amount of sales. This is additional sales that Lacy's lost because it was forced to close. In this Excel file, you are given two sales data sets: Lacys Sales - Lacy's total sales for the 48 months just before the storm County Sales - Total sales for all department stores in the county for the 28 months just before the storm and the four months Lacy's was closed. The data are in Smillions. Based on these data, you are asked to estimate the lost sales for Lacy's for the months of September through December. In addition, we want to see if Lacy's is entitled to the loss of excess sales related to the storm during the same period. Do the following (a) Estimate the sales for Lacy's Department during the 4 months that Lacy's was closed if there were no hurricane (b) Estimate the countywide department store sales during the same period if there were no hurricane. Clarification: Although you are already given the actual sales from September to December sales for year 5, you should obtain forecast these months to see what would have been normal sales for those months given the prior months. So you should use the data prior to September of year 5 to estimate the forecasts for these 4 months (c) Comparing the actual countywide department store sales to the forecasted sale in (b), does it seem like there was substantial excess sales due to hurricane that Lacy's lost out on due to being closed? Compute the. lift factor - actual sales/forecasted sales for each of the 4 months, September to December of year 5. (d) Estimate the lost sales for Lacy's during the 4 months due to hurricane including the excess sales it missed. Hint: For each month during September to December of year 5, multiply Lacy's forecasted sales by the lift factor computed in (c). Then sum these four forecasted monthly sales to estimate the total lost sales. File Home Insert Page Layout Formulas Data Review View X Calibri 11 Wrap Text Paste -A Merge & Center Clipboard Font 5 Alignment F10 > B C E 1 Lacy's Sales 2 Lower Upper confide Confiden Forecast nce Year 1 1 t 1 2 3 4 AN Lacys Sales 3.42 3.8 5.48 8.4 1 + 1 5 2 2 29 2 2 2 6 7 8 3 Month 4 September 5. October 6 November 7 December 8 January 9 February 10 March 11 April 12 May 13 June 14 July 15 August 16 September 17 October 18 November 19 December 20 January 21 February 22 March 23 April 9 3.6 4.06 3.98 4.64 NNNNNN 10 11 4.4 2 2 2 2 2 2 2 3 3 3 3 12 13 14 15 16 17 18 19 20 3 BCF 4.26 4.86 3.8 4.26 5.12 8.32 4.62 3.78 4.04 4.46 4 Costs Sheet1 2 Google 5 Hudson 6 Lacys 6 Col 3 3 3 3 3 3 3 3 4 4 24 May 25 June 26 July 27 August 28 September 29 October 30 November 31 December 32 January 33 February 34 March 35 April 36 May 37 June 38 July 39 August 40 September 41 October 42 November 43 December 44 January 45 February 46 March 47 April 4 4 21 22 23 24 25 26 27 28 29 30 3 32 33 34 35 36 37 38 39 40 41 4 4.78 4.28 4.54 4.42 3.78 4.58 5,66 8.08 4.62 3.98 484 4.9 5.14 + 4.84 18 5 418 5.08 5.94 8.2 5.12 4.56 5.38 496 4 Costs Sheet1 4 4 4 4 4 5 5 5 5 un 42 43 44 3 BCF 2 Google 5 Hudson Ready 6.Lasys 6 County 5 5 5 5 48 May 49 June 50 July 51 August 52 September 53 October 54 November 55 December 56 45 46 47 48 49 50 51 52 5.46 4.74 4.62 4.46 5 5 5 5. Ch18 Homework S22 withou File Home Insert Page Layout Formulas Data Review View Nuance PDF g X Calibri +11 -A A General Et Wrap Text Merge & Center Paste BIU. $ - % Clipboard Font Alignment Number H5 E F B D 1 County-wide Department Store Sales 2 3 Month Year t County Sales 4 September 1 1 111.6 5 October 1 2 112.8 6 November 1 3 142.8 7 December 1 4 235.2 8 January 2 5 93.6 9 February 2 6 10 March 2 7 120 11 April 2 8 115.2 12 May 2 9 123.6 13 June 2 10 116.4 14 July 2 11 112.8 15 August 2 12 126 16 September 2 13 115.2 17 October 2 14 106.8 2 Google 3 BCF 4 Costs Sheet1 5 Hudson Ready 96 00 2 N NN 6 Lacy 6 County x] Ch18 Homework S22 without Solver disx- View Nuance PDF Tell me what File Home Insert Page Layout Formulas Data Review Colon -11 Wrap Text General Paste A. Merge & Center - S - % *82 Cod Form Clipboard Font Alignment Number HS G H B 2 2 3 3 3 3 3 3 3 18 November 19 December 20 January 21 February 22 March 23 April 24 May 25 June 26 July 27 August 28 September 29 October 30 November 31 December 32 January 33 February 34 March 2.Google Head 15 16 17 18 19 20 21 22 23 24 25 26 27 28 79 30 31 D E 142,8 228 93.5 97.2 118.8 116.4 121.2 110.4 102 117.6 99.6 109.2 130.8 204 87.6 91.2 115.2 She S Hudson 6 tacy 3 3 3 3 3 4 4 4 380 4 Costs 6 County EF Ch18 Homework S22 withou File Home Insert Page Layout Formulas Data Review View Nuance PDF g Calibri -111 A General Wrap Text * E Merge & Center Paste BIU > A== $. 96 Clipboard Font Alignment Number HS X V ri 00 D E F G 4 31 4 4 4 4 4 32 33 34 35 36 37 38 34 March 35 April 36 May 37 June 38 July 39 August 40 September 41 October 42 November 43 December 44 January 45 February 46 March 47 April 48 May 49 June 50 July 51 August 52 September 4 4 4 39 4 5 115.2 106.8 112.8 105.6 108 121.2 94.8 109.2 135.6 200.4 96 1032 115.2 116.4 120 114 115.2 123.6 138 5 Hudson 40 41 42 43 44 5 5 5 S 666GSURE 5 5 45 146 47 48 5 5 2 Google 49 4 COSTS Sheet 6 Lacy 6 County Red 9 Step by Step Solution
There are 3 Steps involved in it
1 Expert Approved Answer
Step: 1 Unlock

Question Has Been Solved by an Expert!
Get step-by-step solutions from verified subject matter experts
Step: 2 Unlock
Step: 3 Unlock