

Question: Please help me these question with clear explaination and formula 4.What are the percentage increases of the real earnings and real dividends of the S&P
Please help me these question with clear explaination and formula
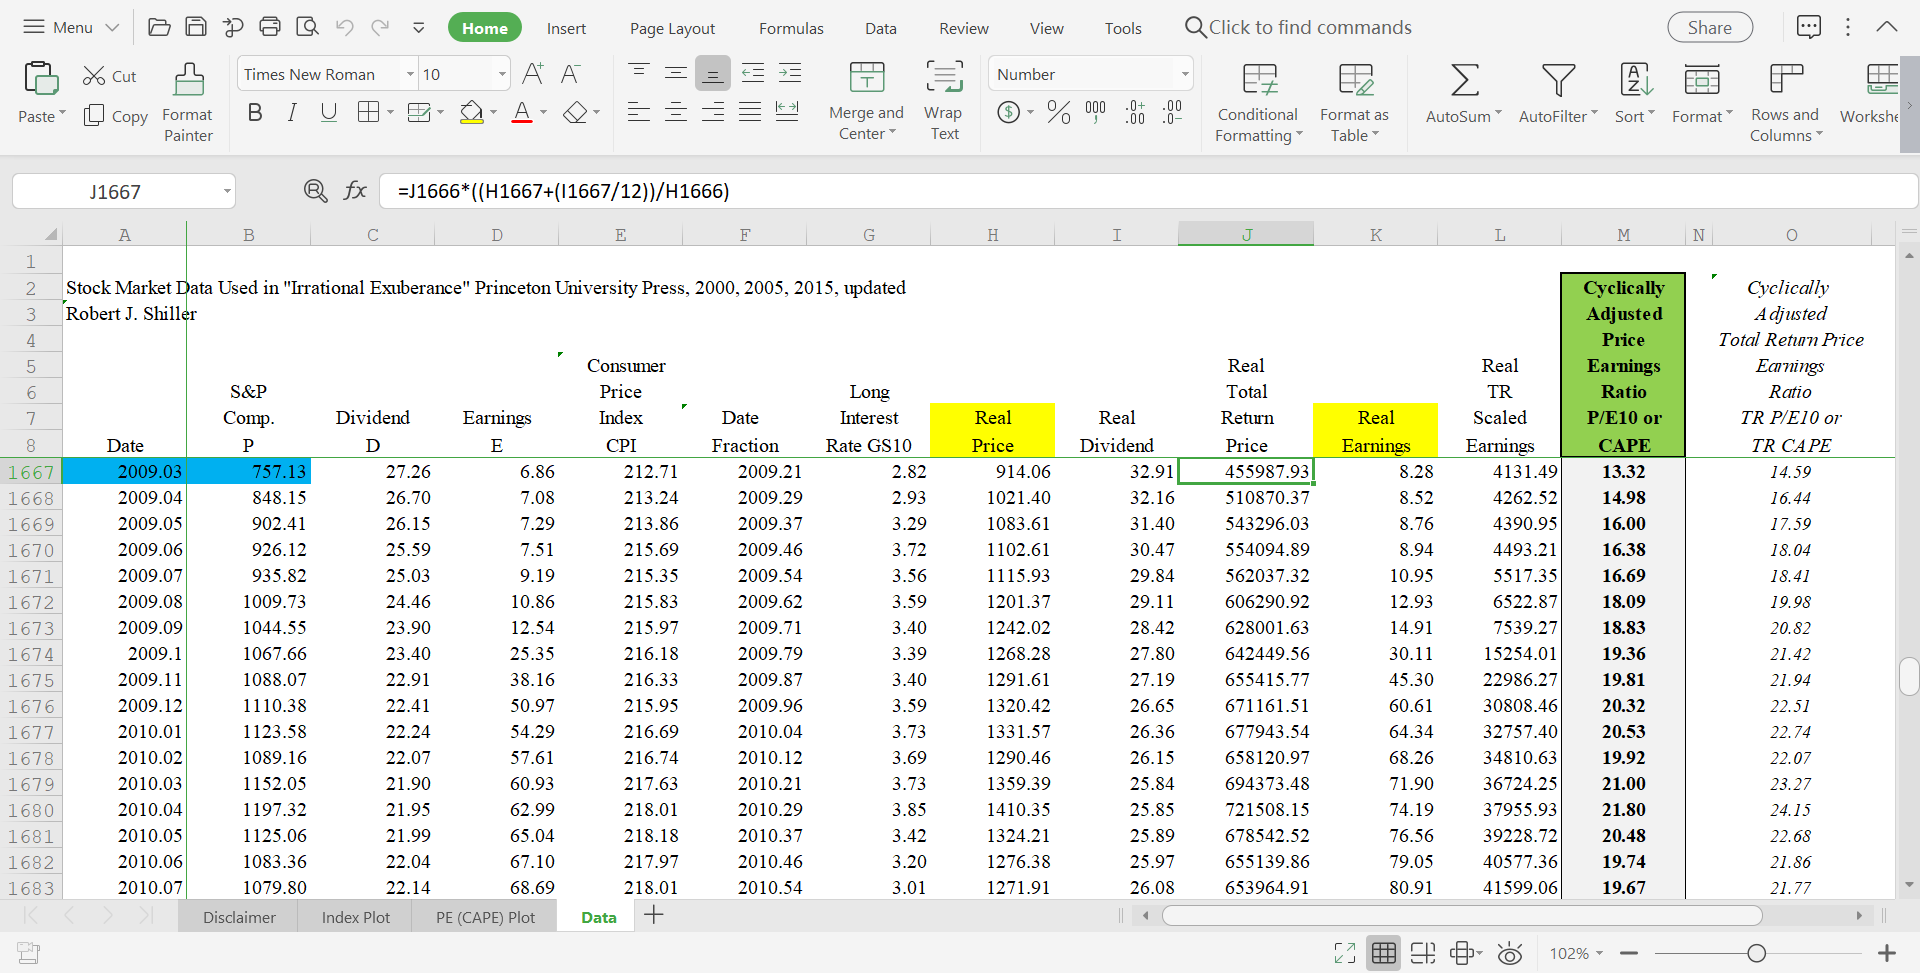
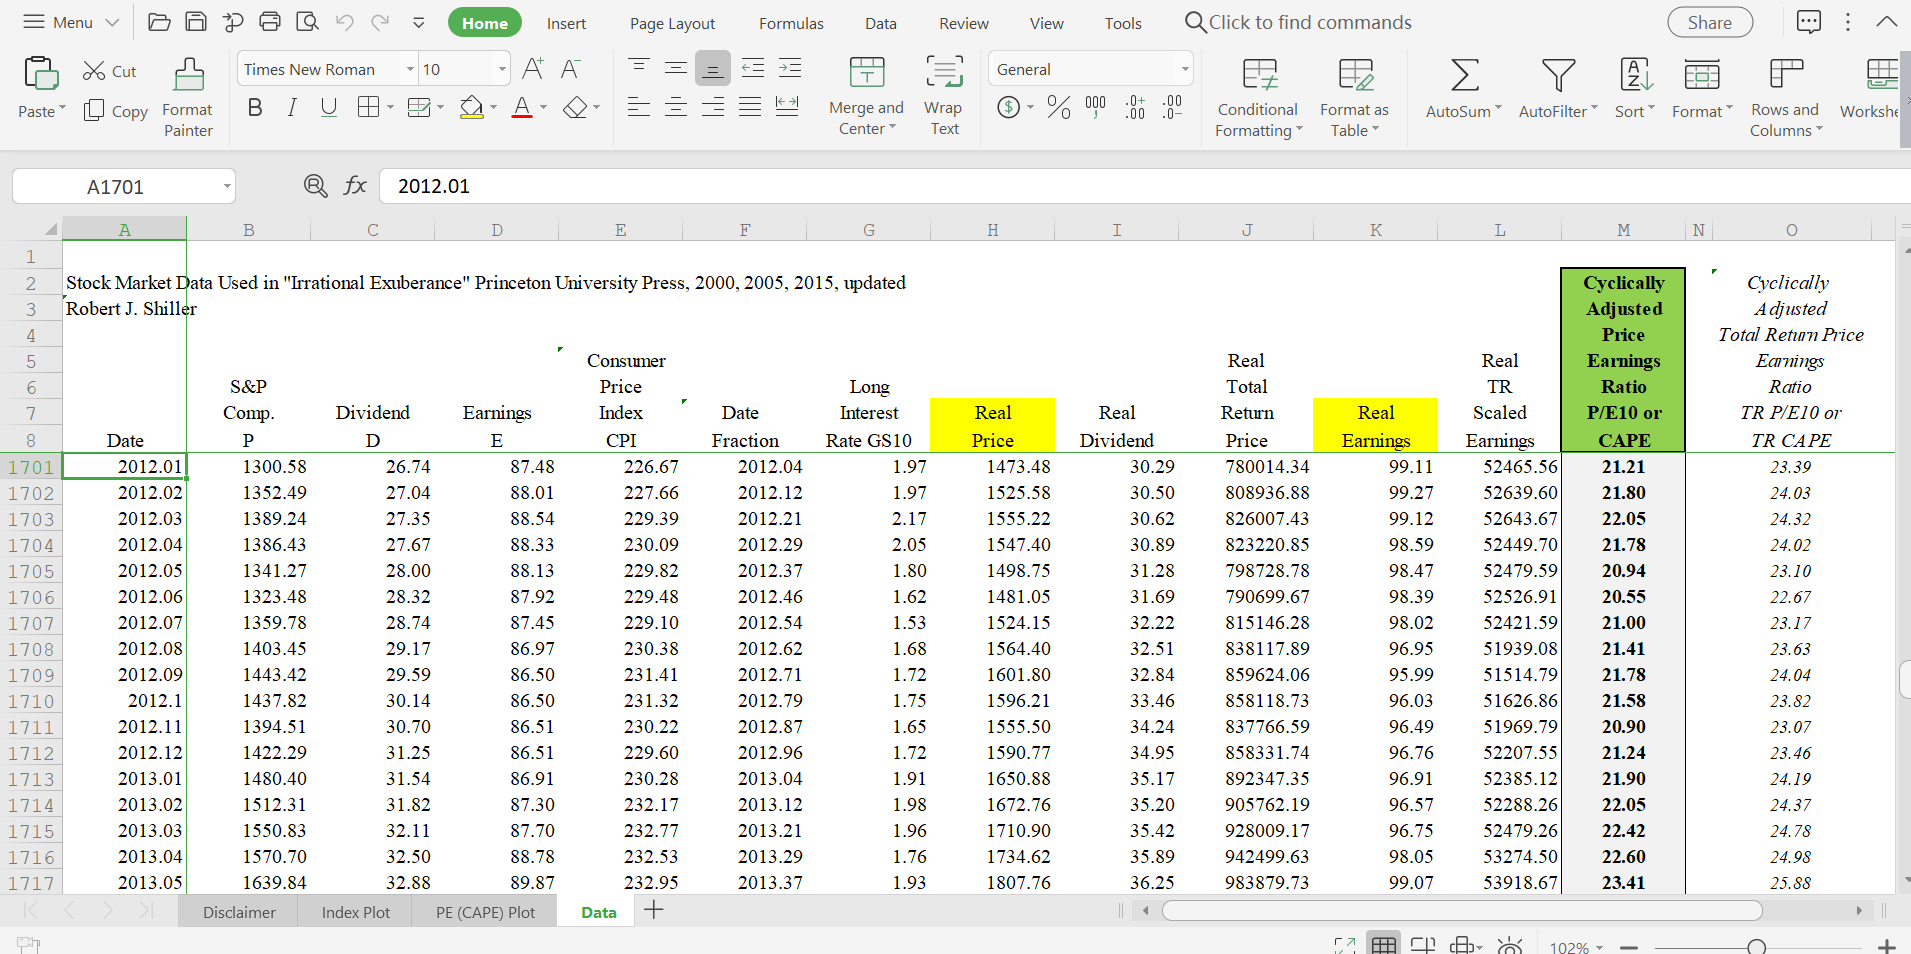
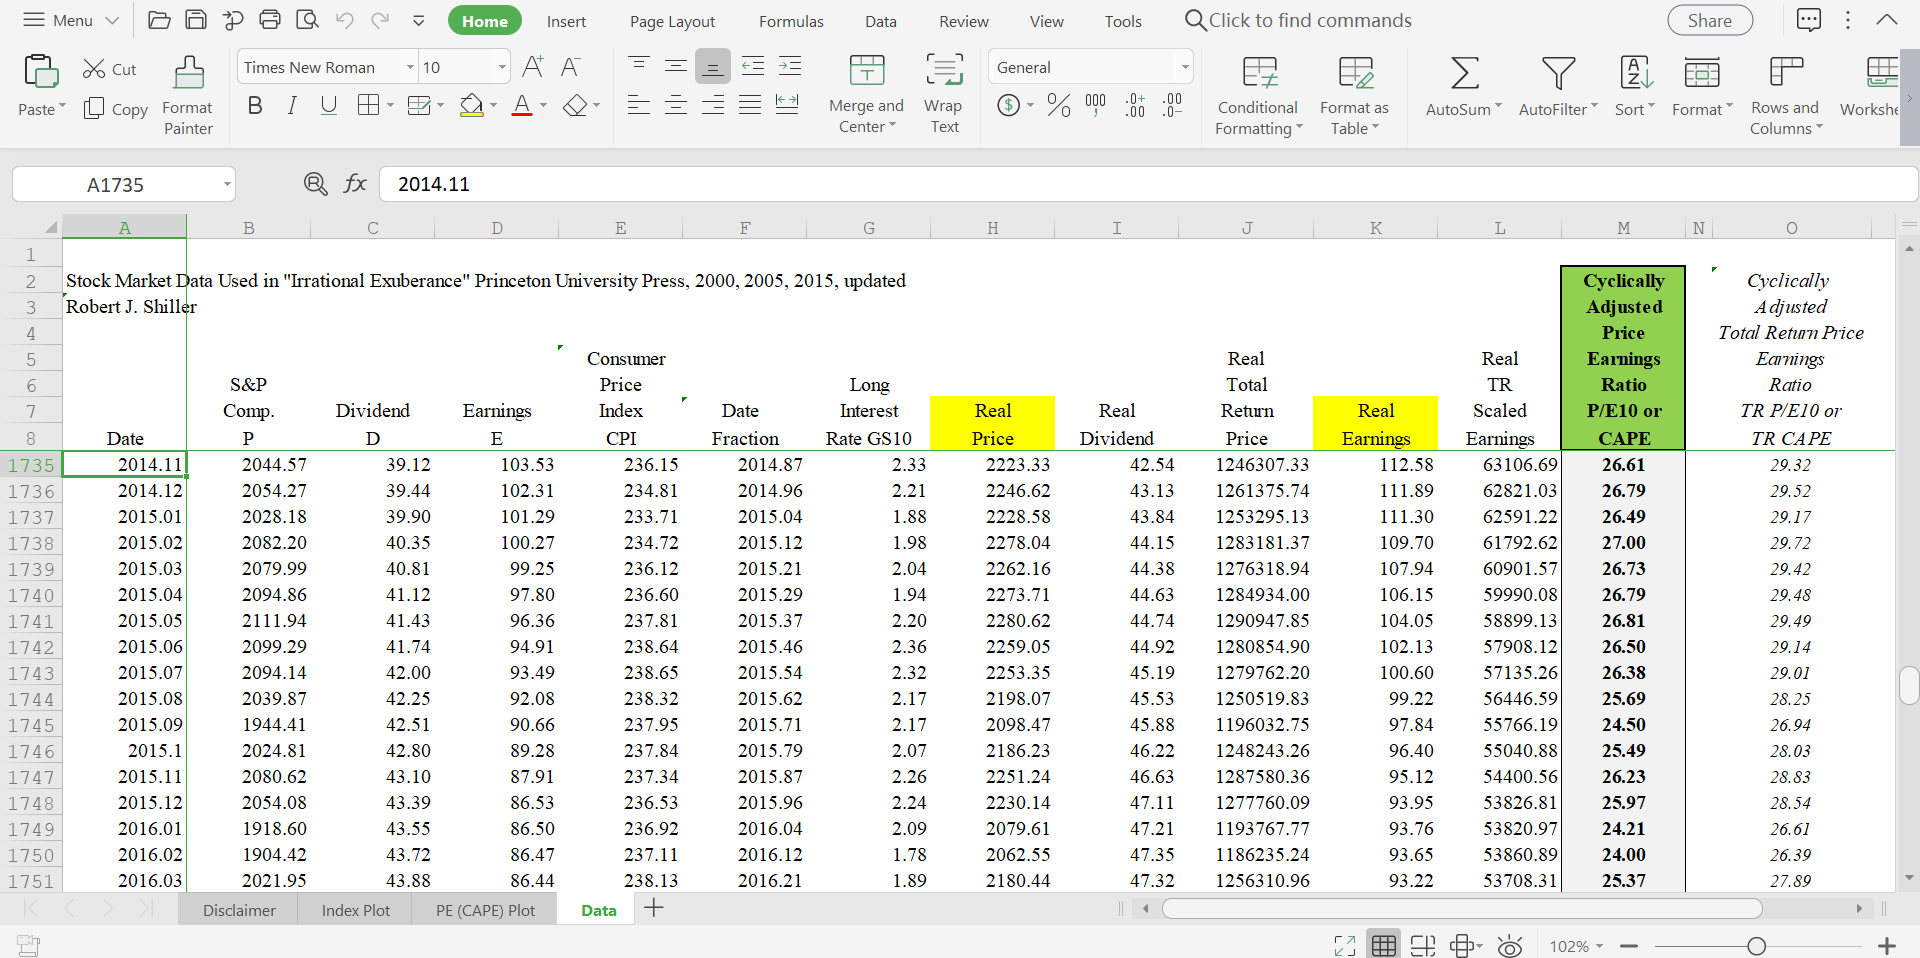
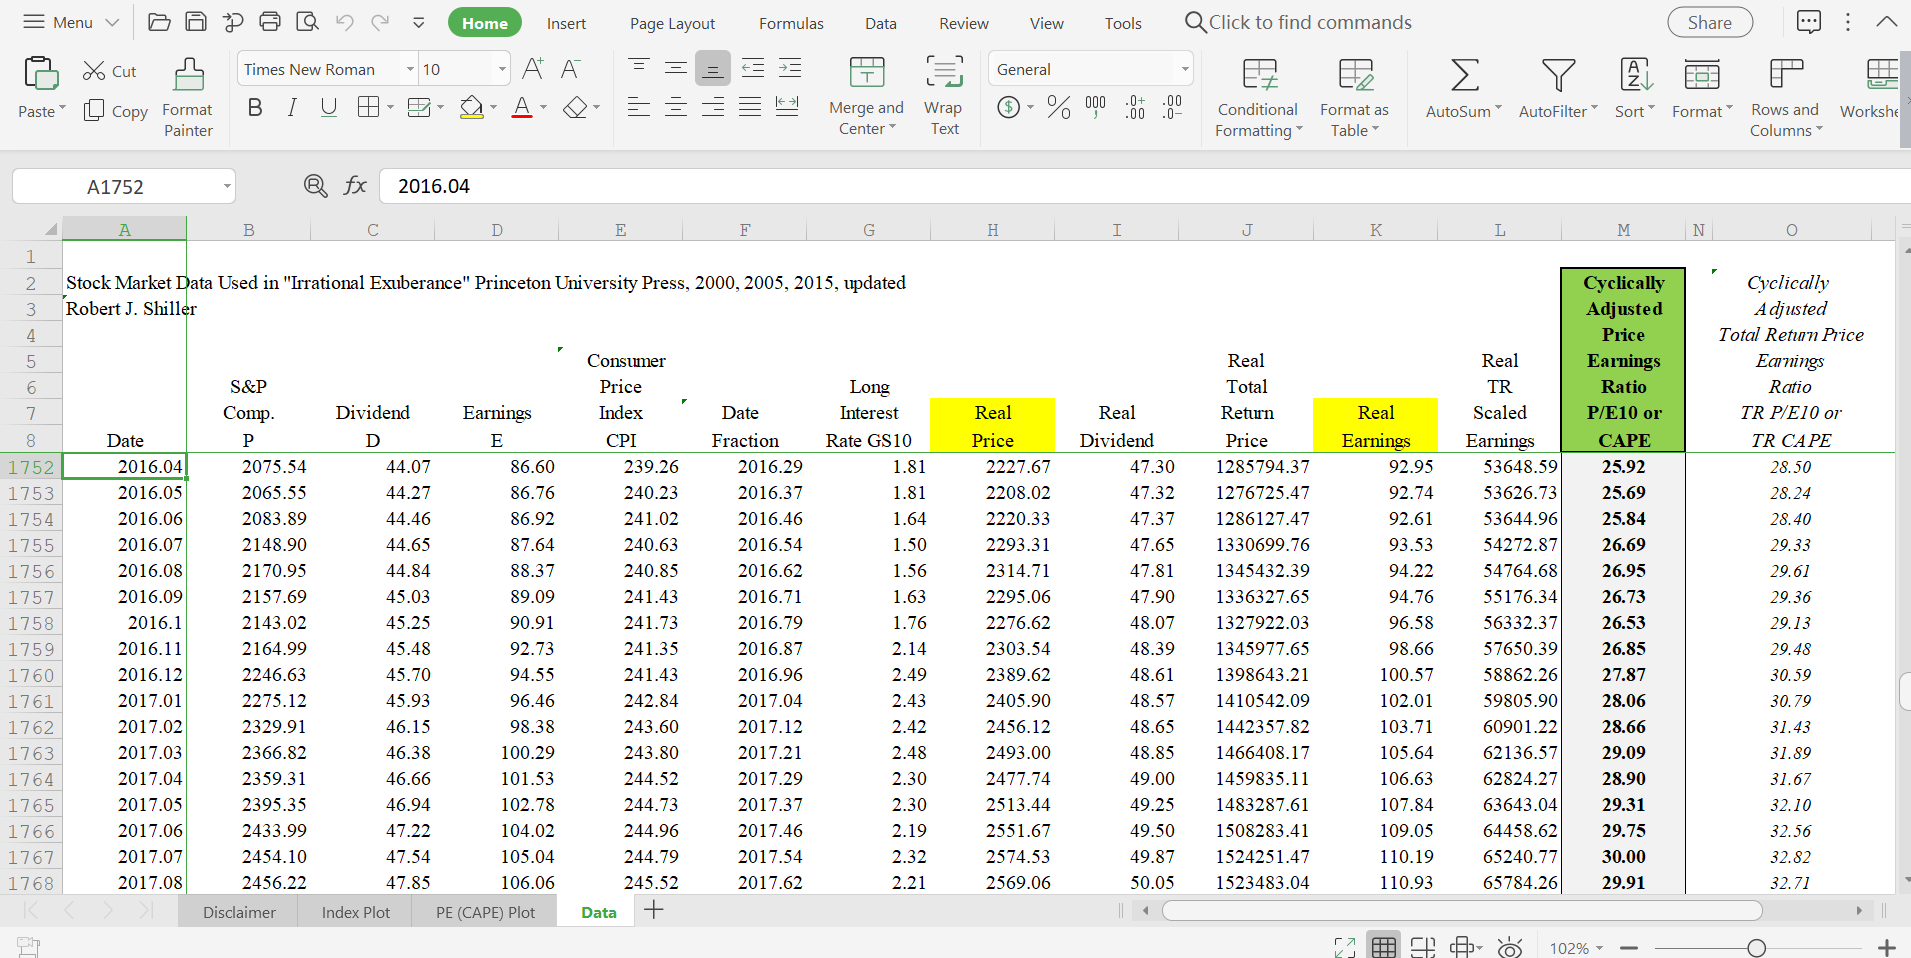
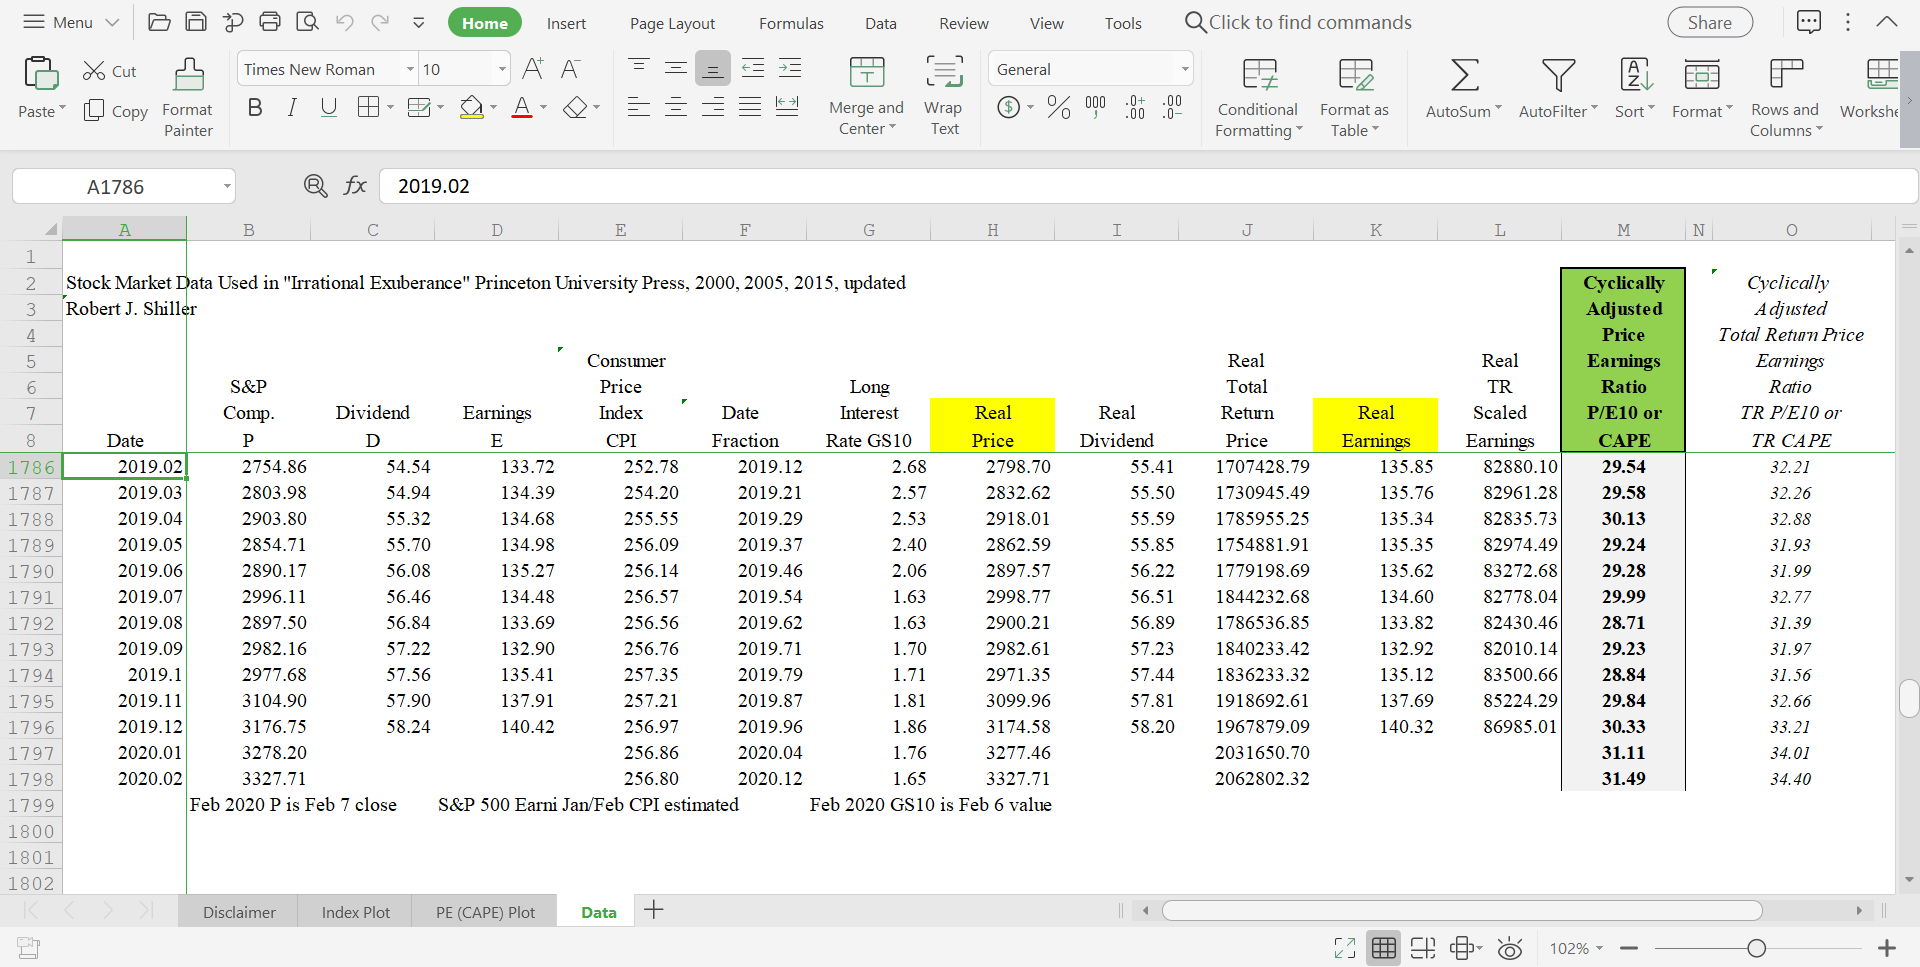
4.What are the percentage increases of the real earnings and real dividends of the S&P 500 from March 2009 to December 2019, the most recent month for which we have data?
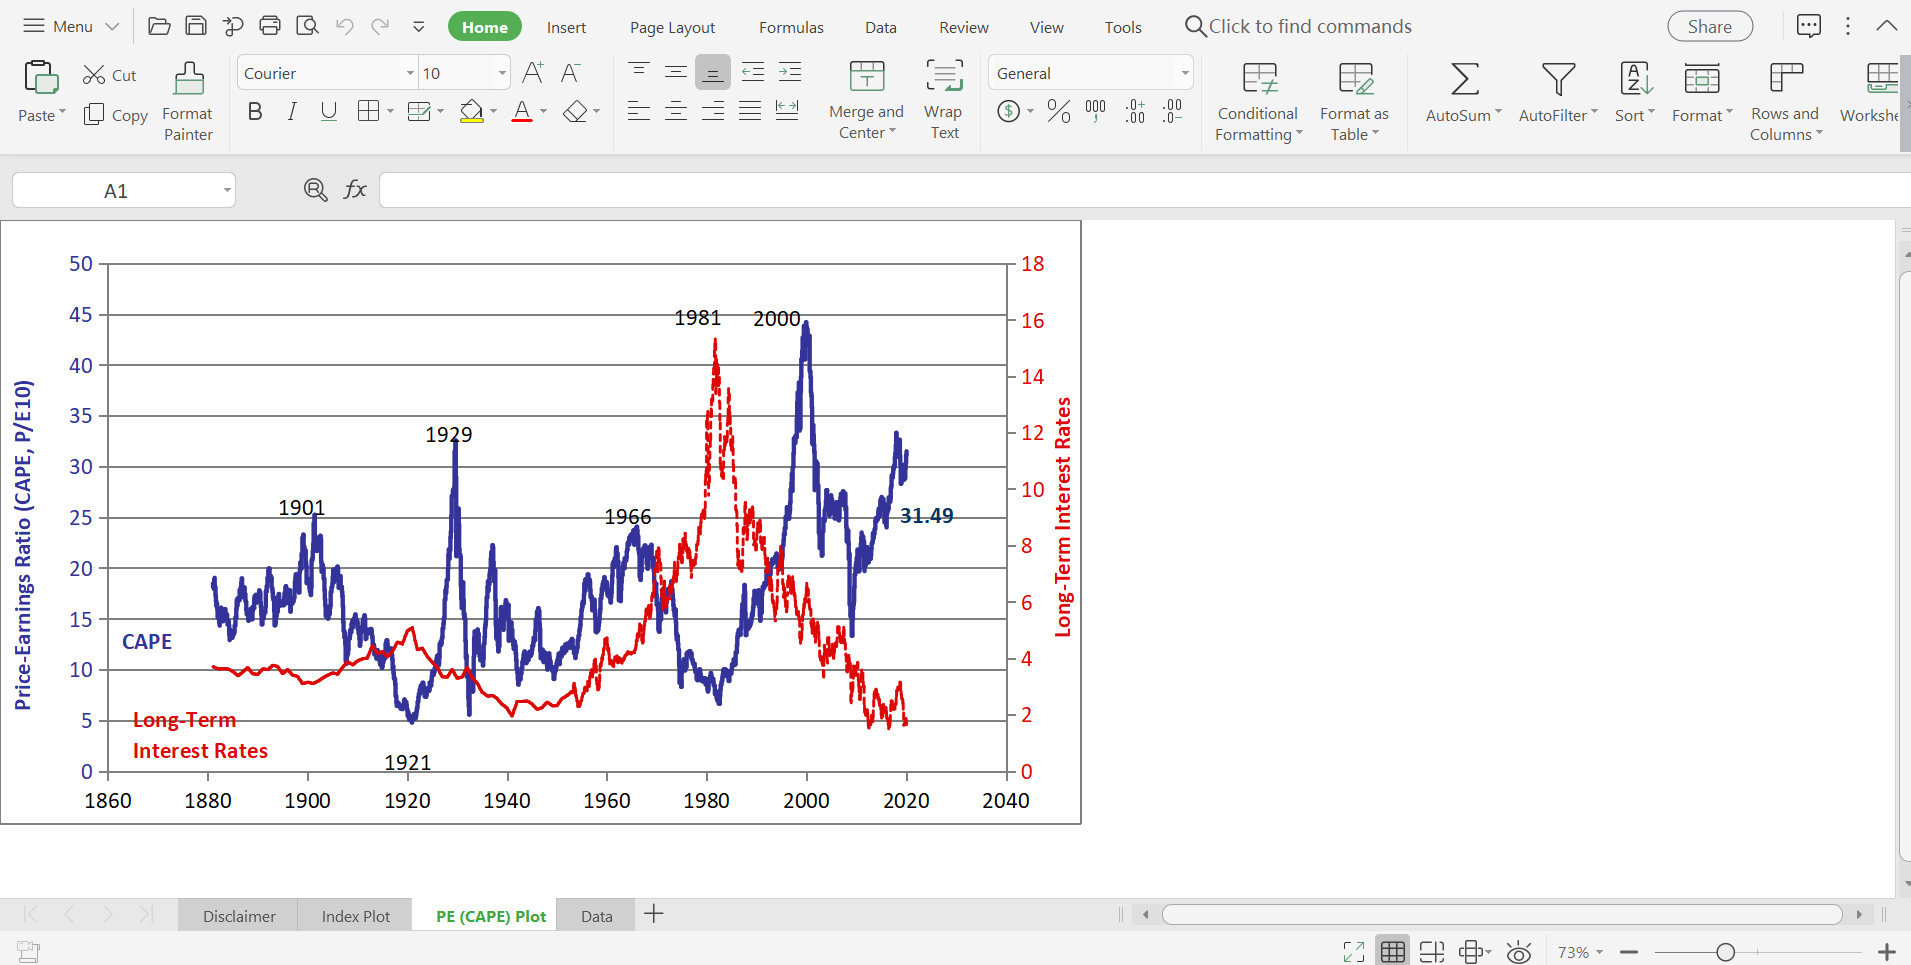
5. What are the CAPE of the S&P 500 in March 2009 and in February 2020, respectively?
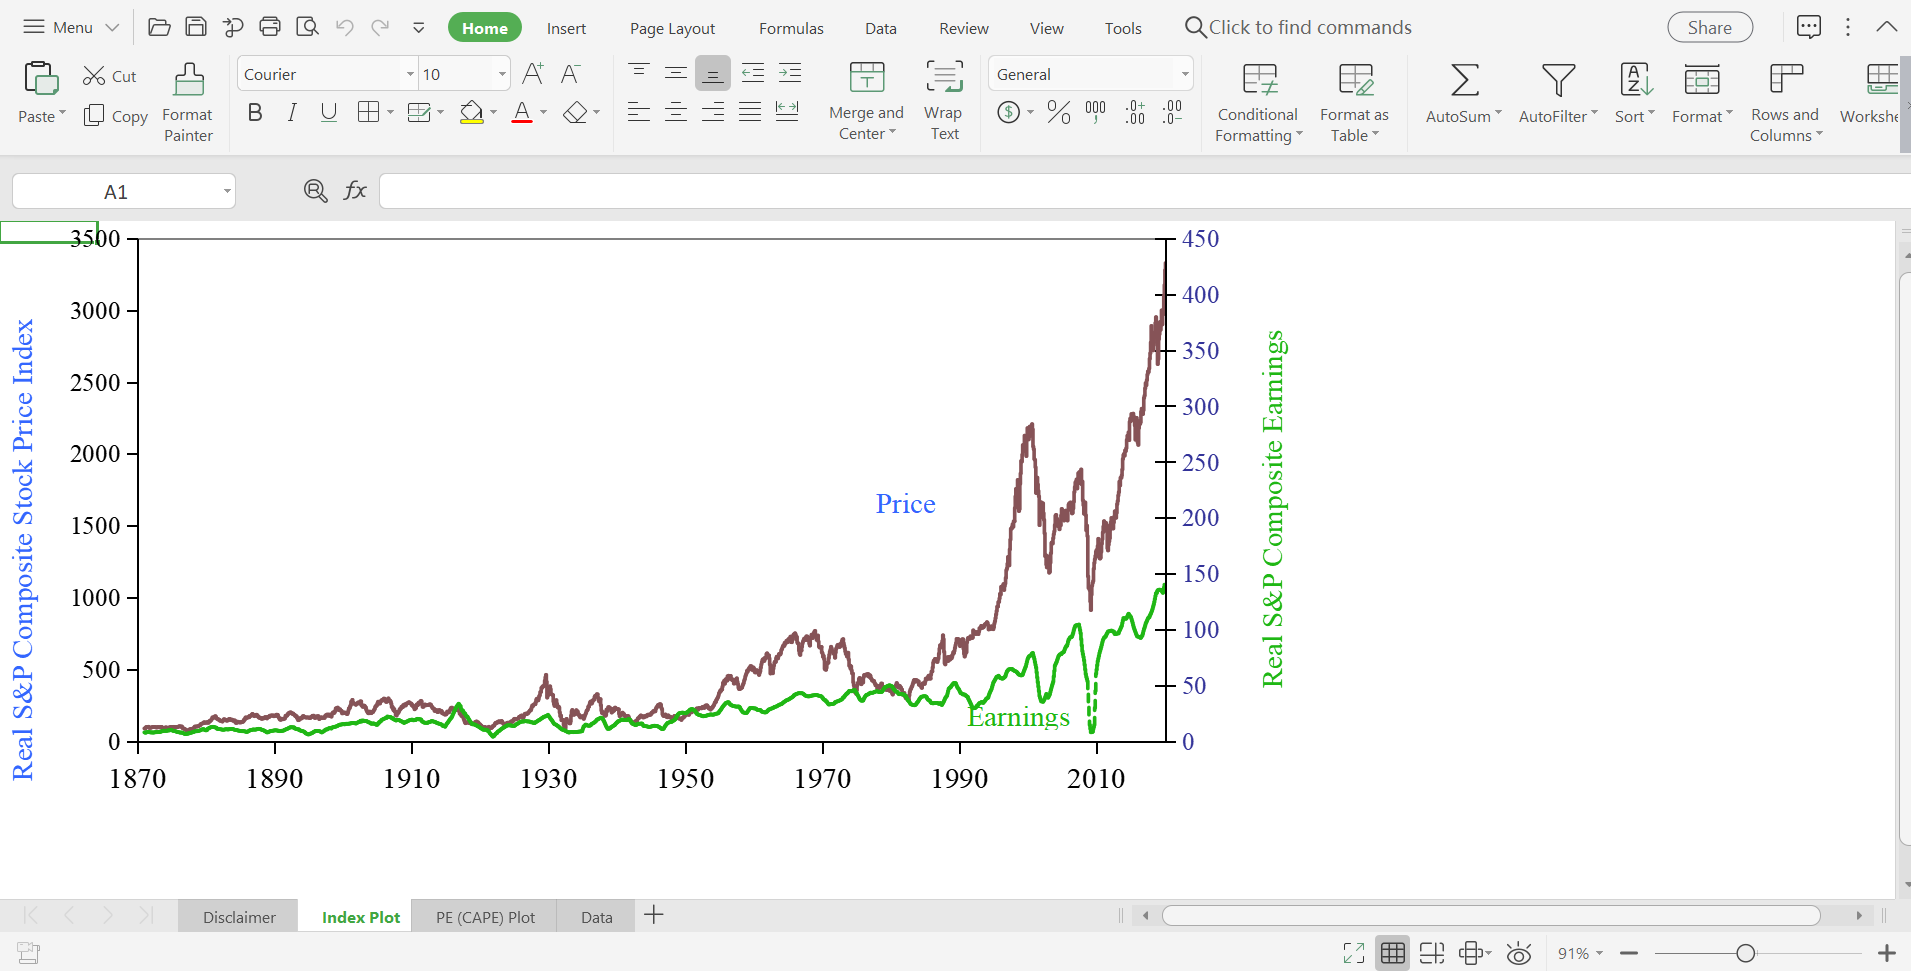
6.Do you think that the S&P 500 index price has increased too fast in the last ten years so that there might be a bubble now?


= Menu Cut Paste Copy Format Painter Times New Roman BIU J1667 A B I> 10 Home Insert Page Layout Formulas Data Review View Tools QClick to find commands Share A A = Number Merge and Center Wrap Text - % 000:00:0- Conditional Formatting Format as Table AutoSum AutoFilter Sort Format fx =J1666*((H1667+(11667/12))/H1666) D E F G H I J K L M N Rows and Columns ^ Workshe 1 2 3 Stock Market Data Used in "Irrational Exuberance" Princeton University Press, 2000, 2005, 2015, updated Robert J. Shiller Cyclically Adjusted 4 5 6 S&P 7 8 Date Comp. P Dividend D Earnings E Consumer Price Index Real Real Long Total Date Interest Real Real Return Real TR Scaled Price Earnings Ratio Cyclically Adjusted Total Return Price Earnings Ratio P/E10 or TR P/E10 or CPI Fraction Rate GS10 Price Dividend Price Earnings Earnings CAPE TR CAPE 1667 2009.03 757.13 27.26 6.86 212.71 2009.21 2.82 914.06 32.91 455987.93 8.28 4131.49 13.32 14.59 1668 2009.04 848.15 26.70 7.08 213.24 2009.29 2.93 1021.40 32.16 510870.37 8.52 4262.52 14.98 16.44 1669 2009.05 902.41 26.15 7.29 213.86 2009.37 3.29 1083.61 31.40 543296.03 8.76 4390.95 16.00 17.59 1670 2009.06 926.12 25.59 7.51 215.69 2009.46 3.72 1102.61 30.47 554094.89 8.94 4493.21 16.38 18.04 1671 2009.07 935.82 25.03 9.19 215.35 2009.54 3.56 1115.93 29.84 562037.32 10.95 5517.35 16.69 18.41 1672 2009.08 1009.73 24.46 10.86 215.83 2009.62 3.59 1201.37 29.11 606290.92 12.93 6522.87 18.09 19.98 1673 2009.09 1044.55 23.90 12.54 215.97 2009.71 3.40 1242.02 28.42 1674 2009.1 1067.66 23.40 25.35 216.18 2009.79 3.39 1268.28 27.80 628001.63 642449.56 14.91 7539.27 18.83 20.82 30.11 15254.01 19.36 21.42 1675 2009.11 1088.07 22.91 38.16 216.33 2009.87 3.40 1291.61 27.19 655415.77 1676 2009.12 1110.38 22.41 50.97 215.95 2009.96 3.59 1320.42 26.65 1677 2010.01 1123.58 22.24 54.29 216.69 2010.04 3.73 1331.57 26.36 1678 2010.02 1089.16 22.07 57.61 216.74 2010.12 3.69 1290.46 26.15 1679 2010.03 1152.05 21.90 60.93 217.63 2010.21 3.73 1359.39 25.84 671161.51 677943.54 658120.97 694373.48 45.30 60.61 64.34 22986.27 30808.46 32757.40 19.81 21.94 20.32 22.51 20.53 22.74 68.26 34810.63 19.92 22.07 71.90 36724.25 21.00 23.27 1680 2010.04 1197.32 21.95 62.99 218.01 2010.29 3.85 1410.35 25.85 721508.15 74.19 37955.93 21.80 24.15 1681 2010.05 1125.06 21.99 65.04 218.18 2010.37 3.42 1324.21 1682 2010.06 1083.36 22.04 67.10 217.97 2010.46 3.20 1276.38 1683 2010.07 1079.80 22.14 68.69 218.01 2010.54 3.01 1271.91 25.89 25.97 26.08 678542.52 655139.86 653964.91 76.56 39228.72 20.48 22.68 79.05 80.91 40577.36 19.74 21.86 41599.06 19.67 21.77 K Disclaimer Index Plot PE (CAPE) Plot Data + O 102% +
Step by Step Solution
There are 3 Steps involved in it

Get step-by-step solutions from verified subject matter experts