

Question: Please help me this homework question e) Here is a boxplot of the lengths for this sample of data. Boxplot of lengths 250 200 150
Please help me this homework question
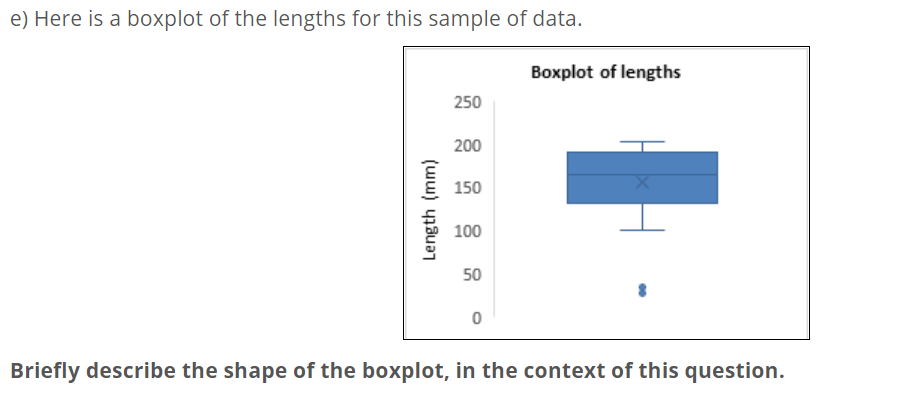
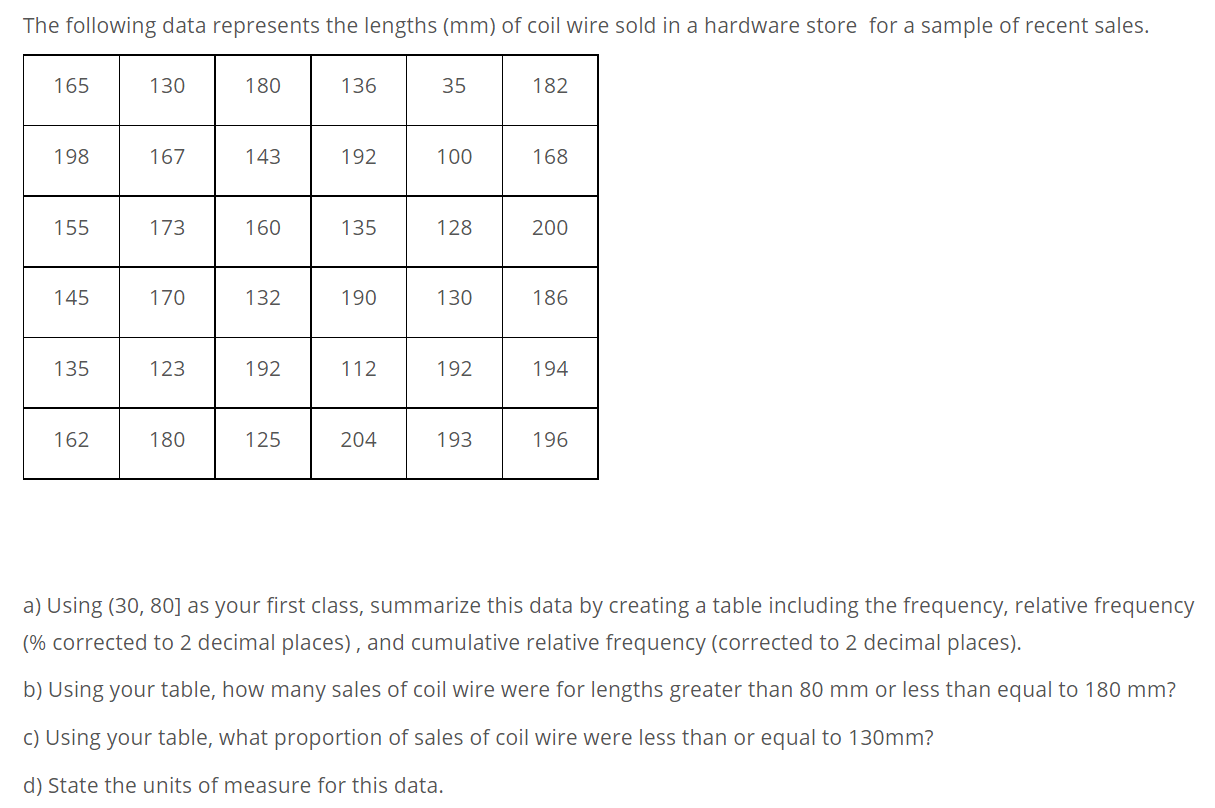
e) Here is a boxplot of the lengths for this sample of data. Boxplot of lengths 250 200 150 X Length (mm) 100 50 0 Briefly describe the shape of the boxplot, in the context of this question.The following data represents the lengths (mm) of coil wire sold in a hardware store for a sample of recent sales. '65 130 '98 167 '55 173 '45 170 '35 123 '62 180 a) Using (30, 80] as your first class, summarize this data by creating a table including the frequency, relative frequency (% corrected to 2 decimal places), and cumulative relative frequency (corrected to 2 decimal places). b} Using your table, how many sales of coil wire were for lengths greater than 80 mm or less than equal to 180 mm? c} Using your table, what proportion of sales of coil wire were less than or equal to 130mm? d} State the units of measure for this data
Step by Step Solution
There are 3 Steps involved in it

Get step-by-step solutions from verified subject matter experts