

Question: Please help me to fill these yellow boxes - show all formulas you use. Thanks. A B D E F G H I K N
Please help me to fill these yellow boxes - show all formulas you use. Thanks.
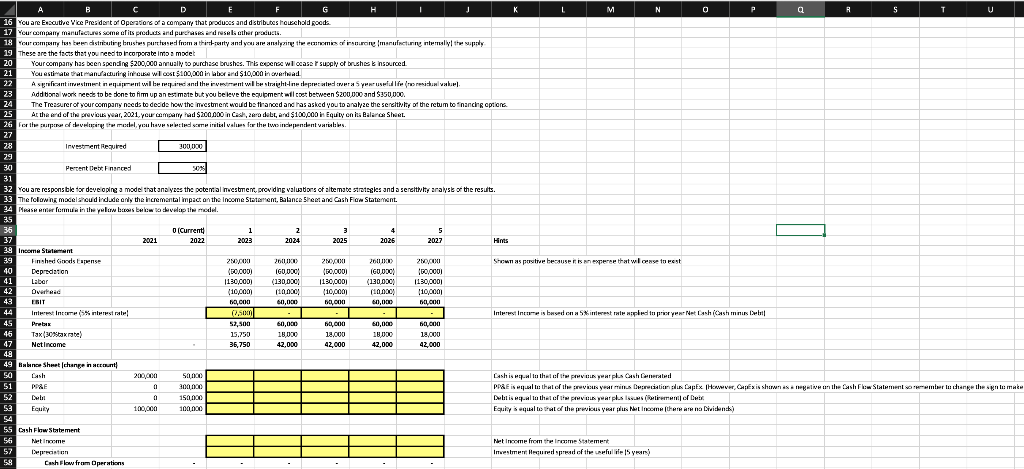
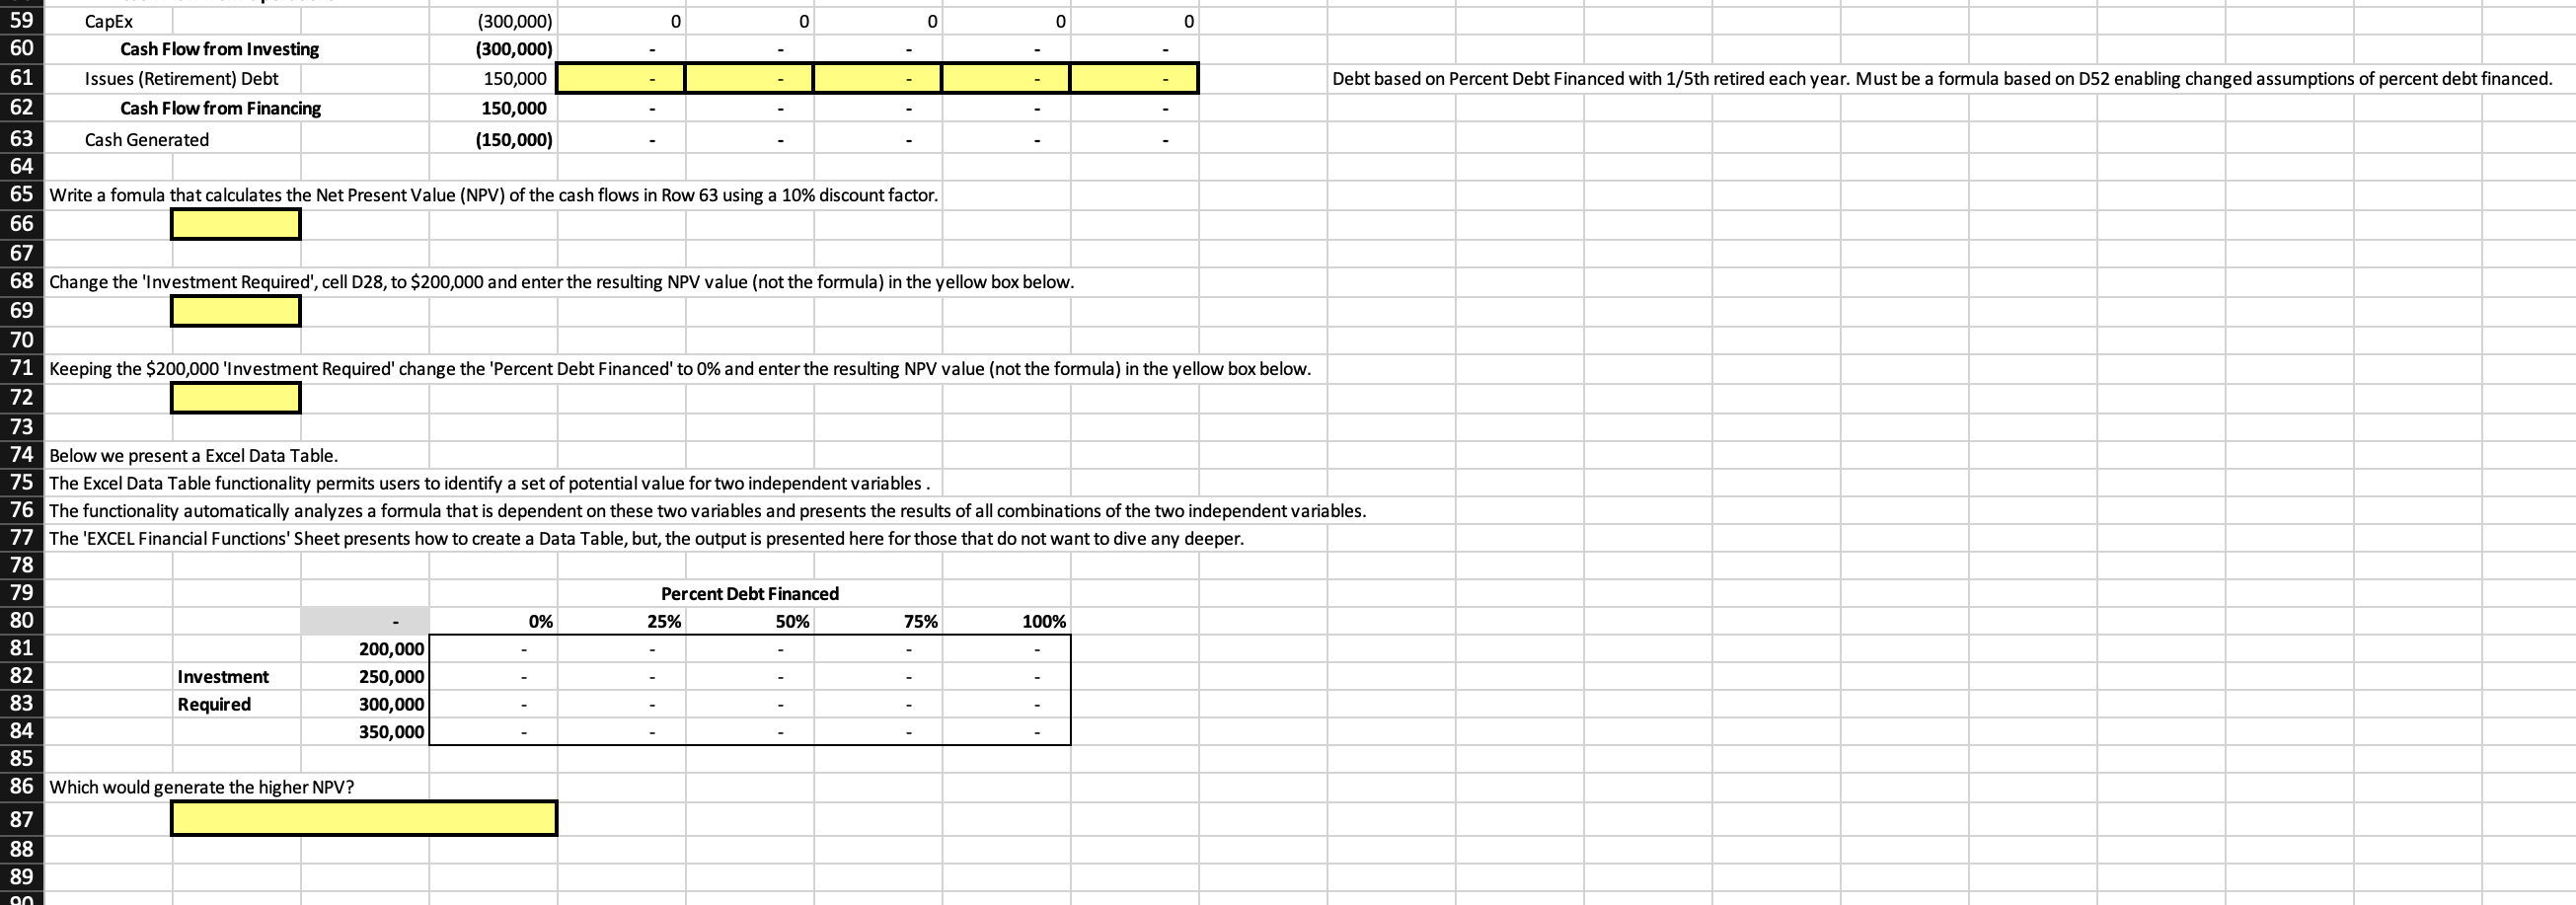
A B D E F G H I K N T U 16 You are Executive Vice President of Operations of a company that produces and distributes household goods 17 Your company manufactures some of its products and purchases and resells other products. 18 Your company has been distributing brushes purchased from a third-party and you are analyzing the economics of insourcing [manufacturing internally the supply. These are the facts that you need to incorporate into a model 20 Your company has been spending $200,000 annually to purchase brushes. This expense will case supply of brushes & insourced. 21 You estimate that manufacturing inhouse will cost $100,000 in labor and $10,000 in overhead. 22 A significant investment in equipment will be required and the investment will be straight-line depreciated over a 5 yearuseful life (no residual wake). 23 Additional work needs to be done to firm up an estimate but you believe the equipment will cost between $200,000 and $350,000. 24 The Treasurer of your company needs to decide how the investment would be financed and has asked you to analyze the sensitivity of the retum to financing options. At the end of the previous year, 2021, your company had $200,000 n Cash, zera debt, and $100,000 in Equity on its Balance Sheet. 2.5 26 For the purpose of developing the model, you have selected some initial values for the two independent variables. 27 28 Investment Required 300,000 29 30 Percent Debt Financed 31 32 You are responsible for developing a model that analyzes the potential investment, providing valuations of altermate strategies and a sensitivity analysis of the results. 33 The following model should include only the incremental impact on the Income Statement, Balance Sheet and Cash Flow Statement. 34 Please enter formule in the yellow bases below to develop the model. 35 36 0 (Current) 1 3 4 5 2 2024 37 2021 2022 2023 2026 Hints 38 Income Statement 39 Finished Goods Expense 250,000 260.000 Shown as positive because it is an experee that will cease to eest 260.000 (60,000) 40 Depredation (50,000) (60,000) 41 Labor 1130,000) (130,000) (130,000) 42 Overhead (10,000) (10,000) (10,000) 43 60,000 60,000 60,000 44 Interest Income (555 interest rate) (2,500) Interest Income is based on a 5% interest rate applied to prior year Net Dash (Cash minus Debt 4.5 Prebix 52,500 60,000 60,000 46 Tax(30%tax rate) 15.750 18,000 18,000 47 Net Income 36,750 42,000 42,000 48 49 Balance Sheet [change in account) 50 Cash Cash is equal to that of the previous year plus Cash Generated 51 PP&E PP&E is equal to that of the previous year minus Depreciation plus CapEx [However, CapExis shown as a negative on the Cash Flow Statement so remember to change the sign to make Debt is equal to that of the previous yearplus Issues (Retirement of Deb 52 Deb 53 Equity Equity is equal to that of the previous year plus Net Income (there are no Dividenck) 55 Cash Flow Statement 56 Net Income Net Income from the Income Statement 57 Depreciation Investment Required spread of the useful life [5 years) 58 Cash Flow from Operations 200,000 0 0 100,000 50,000 300,000 150.000 100,000 2025 250,000 (50,000) 1130,000) (10,000) 60,000 60,000 18,000 42,000 2027 250,000 (60,000) 1130,000) (10,000) 60,000 60,000 18,000 42,000 L M 0 P a R 5 59 CapEx (300,000) 0 0 0 0 60 Cash Flow from Investing (300,000) 61 Issues (Retirement) Debt 150,000 62 Cash Flow from Financing 150,000 (150,000) 63 Cash Generated 64 65 Write a fomula that calculates the Net Present Value (NPV) of the cash flows in Row 63 using a 10% discount factor. 66 67 68 Change the 'Investment Required', cell D28, to $200,000 and enter the resulting NPV value (not the formula) in the yellow box below. 69 70 71 Keeping the $200,000 'Investment Required' change the 'Percent Debt Financed' to 0% and enter the resulting NPV value (not the formula) in the yellow box below. 72 73 74 Below we present a Excel Data Table. 75 The Excel Data Table functionality permits users to identify a set of potential value for two independent variables. 76 The functionality automatically analyzes a formula that is dependent on these two variables and presents the results of all combinations of the two independent variables. 77 The 'EXCEL Financial Functions' Sheet presents how to create a Data Table, but, the output is presented here for those that do not want to dive any deeper. 78 79 Percent Debt Financed 50% 80 0% 25% 75% 100% 81 200,000 82 Investment 250,000 83 Required 300,000 84 350,000 85 86 Which would generate the higher NPV? 87 88 89 90 0 Debt based on Percent Debt Financed with 1/5th retired each year. Must be a formula based on D52 enabling changed assumptions of percent debt financed. A B D E F G H I K N T U 16 You are Executive Vice President of Operations of a company that produces and distributes household goods 17 Your company manufactures some of its products and purchases and resells other products. 18 Your company has been distributing brushes purchased from a third-party and you are analyzing the economics of insourcing [manufacturing internally the supply. These are the facts that you need to incorporate into a model 20 Your company has been spending $200,000 annually to purchase brushes. This expense will case supply of brushes & insourced. 21 You estimate that manufacturing inhouse will cost $100,000 in labor and $10,000 in overhead. 22 A significant investment in equipment will be required and the investment will be straight-line depreciated over a 5 yearuseful life (no residual wake). 23 Additional work needs to be done to firm up an estimate but you believe the equipment will cost between $200,000 and $350,000. 24 The Treasurer of your company needs to decide how the investment would be financed and has asked you to analyze the sensitivity of the retum to financing options. At the end of the previous year, 2021, your company had $200,000 n Cash, zera debt, and $100,000 in Equity on its Balance Sheet. 2.5 26 For the purpose of developing the model, you have selected some initial values for the two independent variables. 27 28 Investment Required 300,000 29 30 Percent Debt Financed 31 32 You are responsible for developing a model that analyzes the potential investment, providing valuations of altermate strategies and a sensitivity analysis of the results. 33 The following model should include only the incremental impact on the Income Statement, Balance Sheet and Cash Flow Statement. 34 Please enter formule in the yellow bases below to develop the model. 35 36 0 (Current) 1 3 4 5 2 2024 37 2021 2022 2023 2026 Hints 38 Income Statement 39 Finished Goods Expense 250,000 260.000 Shown as positive because it is an experee that will cease to eest 260.000 (60,000) 40 Depredation (50,000) (60,000) 41 Labor 1130,000) (130,000) (130,000) 42 Overhead (10,000) (10,000) (10,000) 43 60,000 60,000 60,000 44 Interest Income (555 interest rate) (2,500) Interest Income is based on a 5% interest rate applied to prior year Net Dash (Cash minus Debt 4.5 Prebix 52,500 60,000 60,000 46 Tax(30%tax rate) 15.750 18,000 18,000 47 Net Income 36,750 42,000 42,000 48 49 Balance Sheet [change in account) 50 Cash Cash is equal to that of the previous year plus Cash Generated 51 PP&E PP&E is equal to that of the previous year minus Depreciation plus CapEx [However, CapExis shown as a negative on the Cash Flow Statement so remember to change the sign to make Debt is equal to that of the previous yearplus Issues (Retirement of Deb 52 Deb 53 Equity Equity is equal to that of the previous year plus Net Income (there are no Dividenck) 55 Cash Flow Statement 56 Net Income Net Income from the Income Statement 57 Depreciation Investment Required spread of the useful life [5 years) 58 Cash Flow from Operations 200,000 0 0 100,000 50,000 300,000 150.000 100,000 2025 250,000 (50,000) 1130,000) (10,000) 60,000 60,000 18,000 42,000 2027 250,000 (60,000) 1130,000) (10,000) 60,000 60,000 18,000 42,000 L M 0 P a R 5 59 CapEx (300,000) 0 0 0 0 60 Cash Flow from Investing (300,000) 61 Issues (Retirement) Debt 150,000 62 Cash Flow from Financing 150,000 (150,000) 63 Cash Generated 64 65 Write a fomula that calculates the Net Present Value (NPV) of the cash flows in Row 63 using a 10% discount factor. 66 67 68 Change the 'Investment Required', cell D28, to $200,000 and enter the resulting NPV value (not the formula) in the yellow box below. 69 70 71 Keeping the $200,000 'Investment Required' change the 'Percent Debt Financed' to 0% and enter the resulting NPV value (not the formula) in the yellow box below. 72 73 74 Below we present a Excel Data Table. 75 The Excel Data Table functionality permits users to identify a set of potential value for two independent variables. 76 The functionality automatically analyzes a formula that is dependent on these two variables and presents the results of all combinations of the two independent variables. 77 The 'EXCEL Financial Functions' Sheet presents how to create a Data Table, but, the output is presented here for those that do not want to dive any deeper. 78 79 Percent Debt Financed 50% 80 0% 25% 75% 100% 81 200,000 82 Investment 250,000 83 Required 300,000 84 350,000 85 86 Which would generate the higher NPV? 87 88 89 90 0 Debt based on Percent Debt Financed with 1/5th retired each year. Must be a formula based on D52 enabling changed assumptions of percent debt financed
Step by Step Solution
There are 3 Steps involved in it

Get step-by-step solutions from verified subject matter experts