

Question: Please help me to solve this. What is the statistical inference for this correlation (should H 0 be rejected) and how can you tell? Answer
Please help me to solve this.
What is the statistical inference for this correlation (should H0be rejected)andhow can you tell?
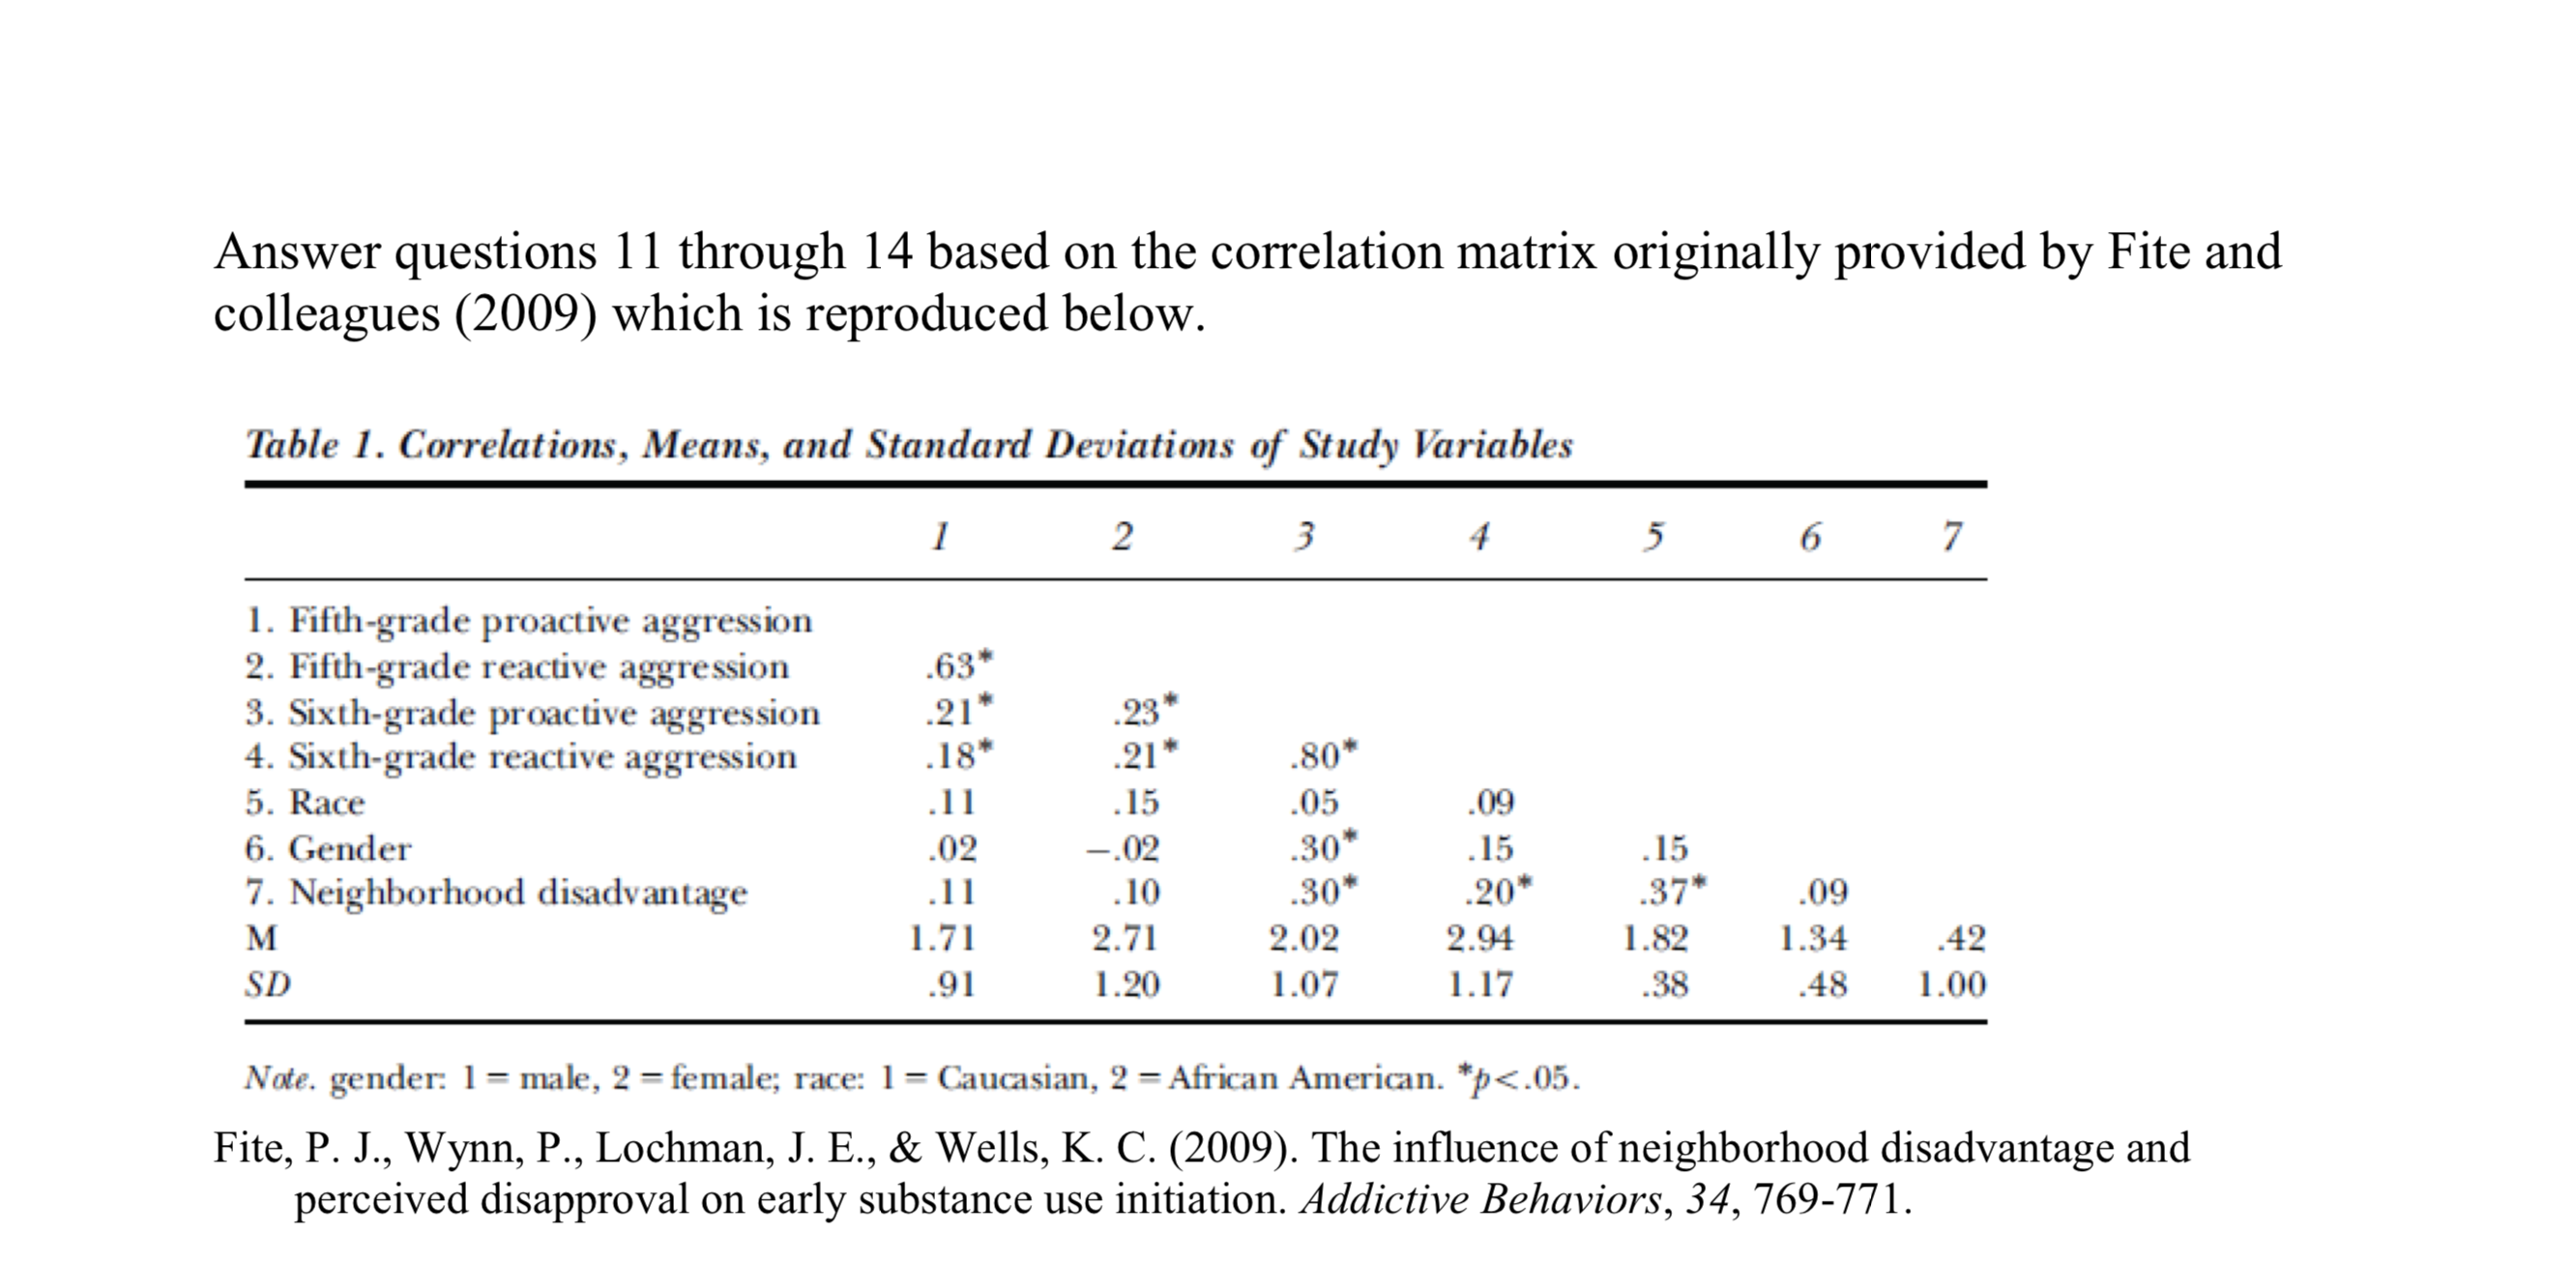
Answer questions 11 through 14 based on the correlation matrix originally provided by Fite and colleagues (2009) which is reproduced below. Table 1. Correlations, Means, and Standard Deviations of Study Variables 1 2 3 4 5 6 7 1. Fifth-grade proactive aggression 2. Fifth-grade reactive aggression .63* 3. Sixth-grade proactive aggression 21* 4. Sixth-grade reactive aggression . 18* 5. Race .21* 80* 6. Gender .11 . 15 .05 .09 7. Neighborhood disadvantage .02 -.02 .30* . 15 M .11 .15 .10 .30* .20* .37* .09 SD 1.71 2.71 2.02 2.94 .91 1.20 1.82 1.34 1.07 .42 1.17 .38 .48 1.00 Note. gender: 1 = male, 2 = female; race: 1 = Caucasian, 2 = African American. *p<.05. fite p. j. wynn lochman e. wells k. c. the influence of neighborhood disadvantage and perceived disapproval on early substance use initiation. addictive behaviors>
Step by Step Solution
There are 3 Steps involved in it

Get step-by-step solutions from verified subject matter experts