Question: please help me understand and solve this. I will post several questions but separately thank you for the help ! Calculate X-bar-bar, R-bar, and associated

please help me understand and solve this. I will post several questions but separately thank you for the help !

please help me understand and solve this. I will

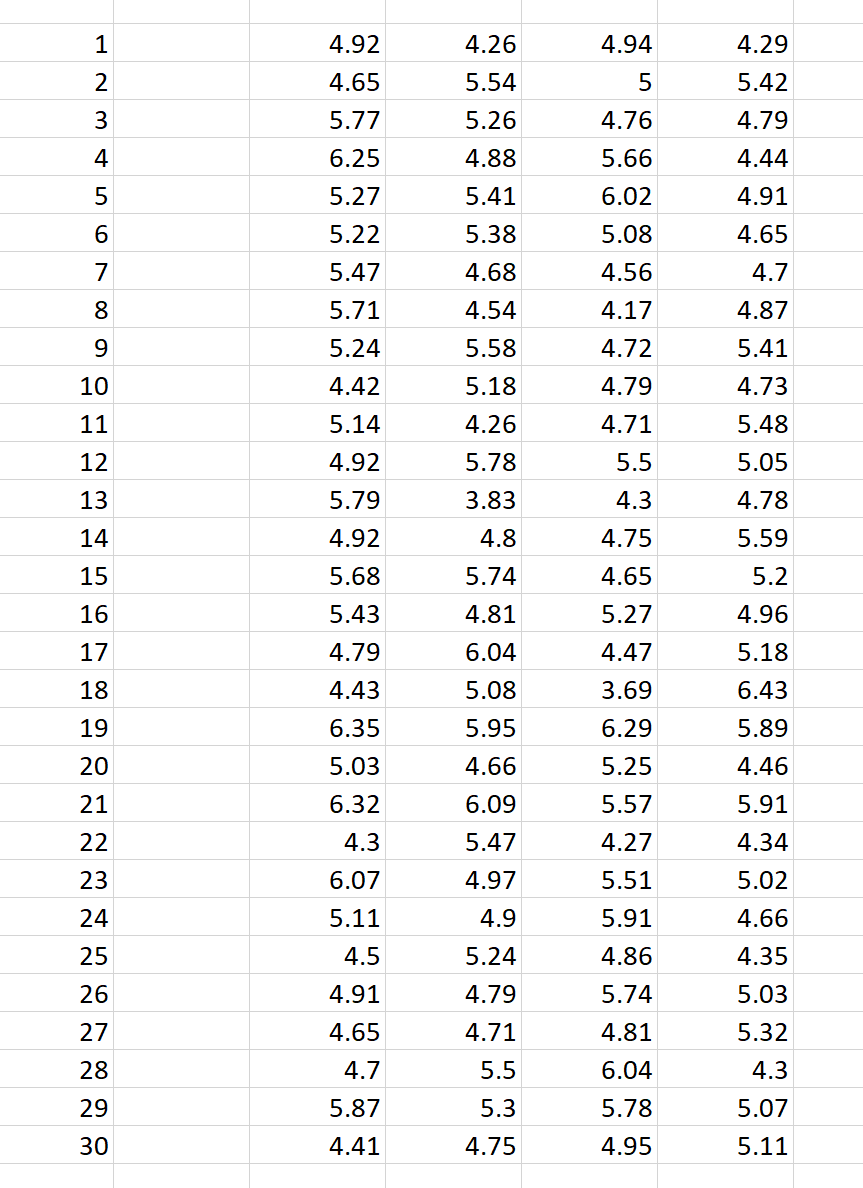
  1. Calculate X-bar-bar, R-bar, and associated control limits using the data in the table above.
  2. Create x and R (average and range) control charts from the data in the table above.
4.94 1 2 4.92 4.65 5.77 5 3 4 6.25 5 6 4.76 5.66 6.02 5.08 4.56 4.17 4.72 4.79 7 8 9 10 11 4.71 12 13 14 15 16 5.27 5.22 5.47 5.71 5.24 4.42 5.14 4.92 5.79 4.92 5.68 5.43 4.79 4.43 6.35 4.26 5.54 5.26 4.88 5.41 5.38 4.68 4.54 5.58 5.18 4.26 5.78 3.83 | 4.8 5.74 4.81 6.04 5.08 5.95 4.66 6.09 5.47 4.97 4.29 5.42 4.79 4.44 4.91 4.65 4.7 4.87 5.41 4.73 5.48 5.05 4.78 5.59 5.2 4.96 5.18 6.43 5.89 4.46 5.91 4.34 5.02 4.66 4.35 5.03 5.32 4.3 17 5.5 4.3 4.75 4.65 5.27 4.47 3.69 6.29 5.25 5.57 4.27 5.51 5.91 18 19 5.03 20 21 22 23 24 25 4.86 6.32 14.3 6.07 5.11 14.5 4.91 4.65 14.7 5.87 4.41 26 14.9 5.24 4.79 4.71 5.5 5.3 27 28 5.74 4.81 6.04 5.78 4.95 29 5.07 30 4.75 5.11

Step by Step Solution

There are 3 Steps involved in it

1 Expert Approved Answer
Step: 1 Unlock blur-text-image
Question Has Been Solved by an Expert!

Get step-by-step solutions from verified subject matter experts

Step: 2 Unlock
Step: 3 Unlock

Students Have Also Explored These Related General Management Questions!