

Question: Please help me understand: Bonus 3! The scatterplot below shows the relationship between horsepower and fuel economy for 82 cars from the 1980's. Classic Cars
Please help me understand:
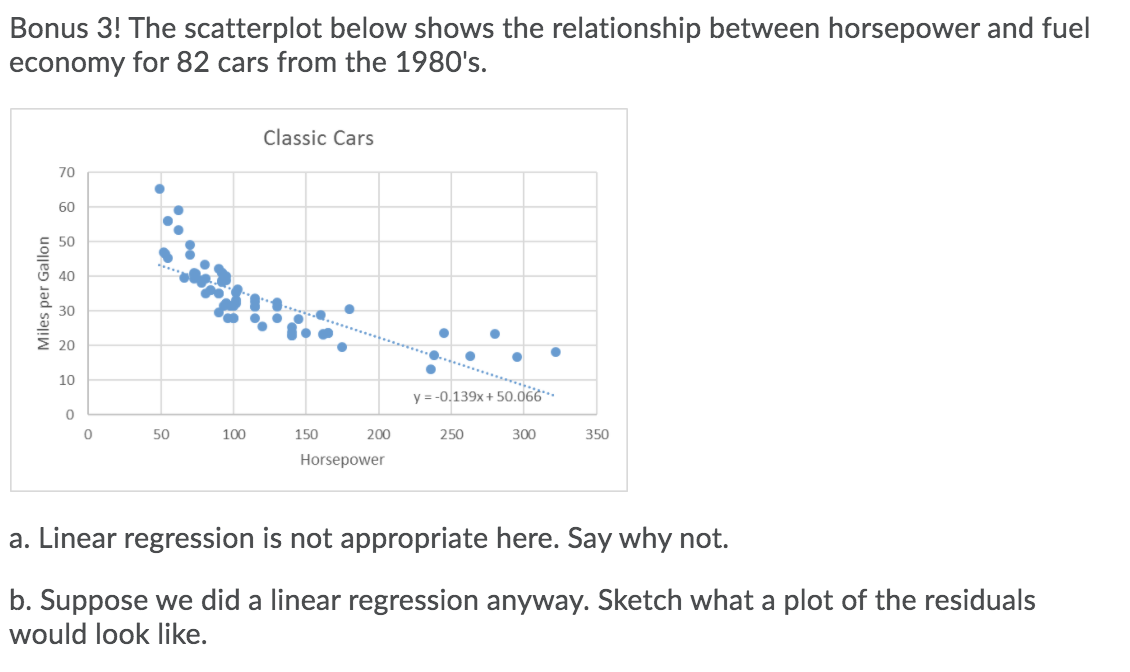
Bonus 3! The scatterplot below shows the relationship between horsepower and fuel economy for 82 cars from the 1980's. Classic Cars 70 60 50 40 Miles per Gallon 30 20 10 y =-0.139x + 50.066*.. O 50 100 150 200 250 300 350 Horsepower a. Linear regression is not appropriate here. Say why not. b. Suppose we did a linear regression anyway. Sketch what a plot of the residuals would look like
Step by Step Solution
There are 3 Steps involved in it
1 Expert Approved Answer
Step: 1 Unlock

Question Has Been Solved by an Expert!
Get step-by-step solutions from verified subject matter experts
Step: 2 Unlock
Step: 3 Unlock