

Question: Please help me understand how to work through problems like these The data given to the right includes data from 36 candies, and 9 of
Please help me understand how to work through problems like these
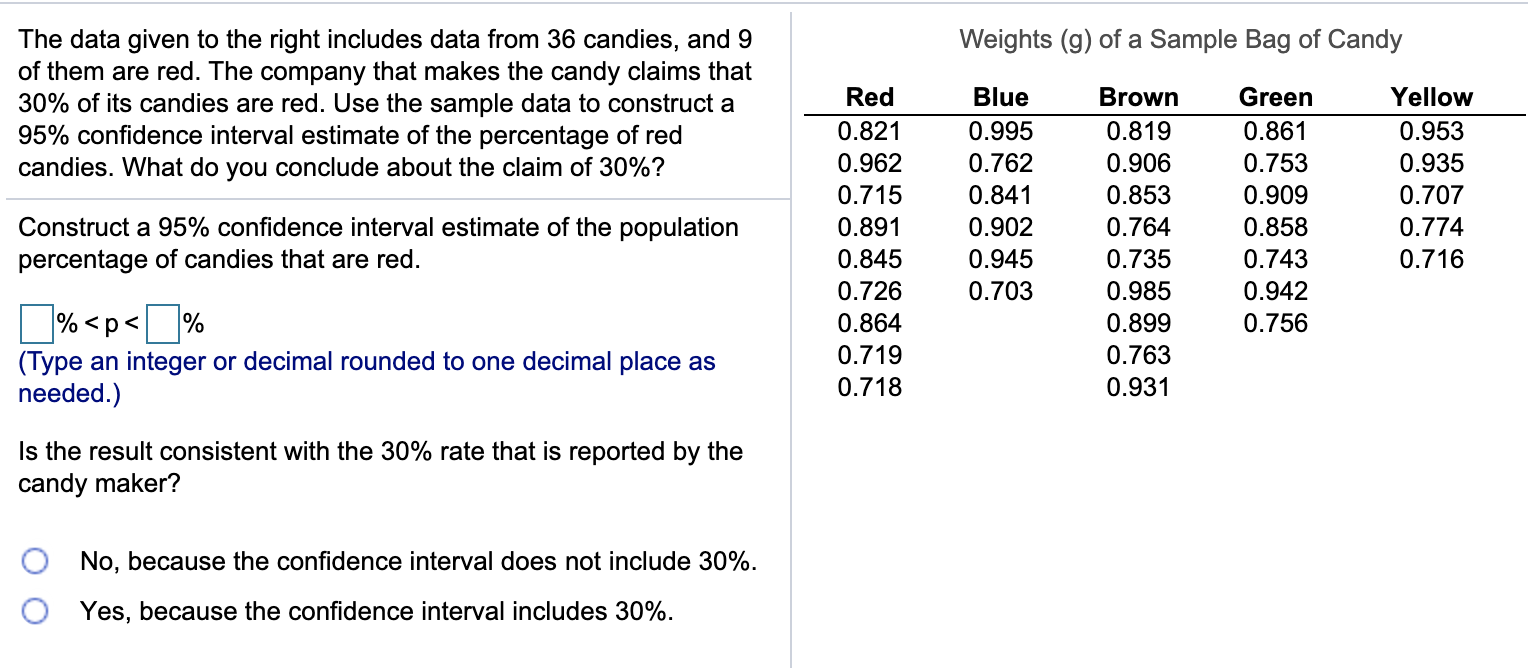
The data given to the right includes data from 36 candies, and 9 of them are red. The company that makes the candy claims that Weights (g) of a Sample Bag of Candy 30% of its candies are red. Use the sample data to construct a Red Blue Brown Green Yellow 95% confidence interval estimate of the percentage of red 0.821 0.995 0.819 0.861 0.953 candies. What do you conclude about the claim of 30%? 0.962 0.762 0.906 0.753 0.935 0.715 0.841 0.853 Construct a 95% confidence interval estimate of the population 0.909 0.707 0.891 0.902 0.764 0.858 percentage of candies that are red. 0.774 0.845 0.945 0.735 0.743 0.716 %
Step by Step Solution
There are 3 Steps involved in it

Get step-by-step solutions from verified subject matter experts