

Question: Please help me understand these questions and please Type the steps to help me understand using the typing mathematical equations options here and for graphs
Please help me understand these questions and please Type the steps to help me understand using the typing mathematical equations options here and for graphs please try and make it as readable as possible using a graphing software or drawing it very clearly. Thank you.
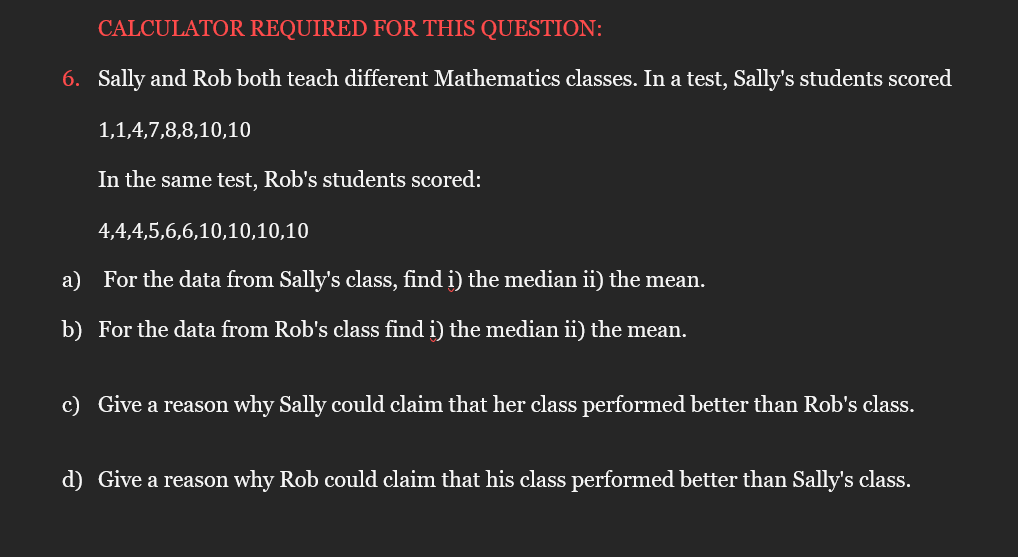
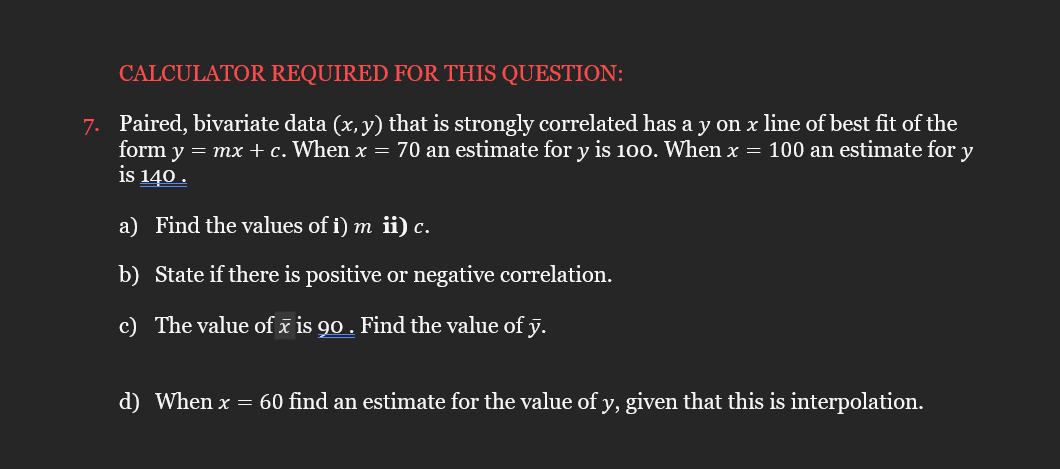
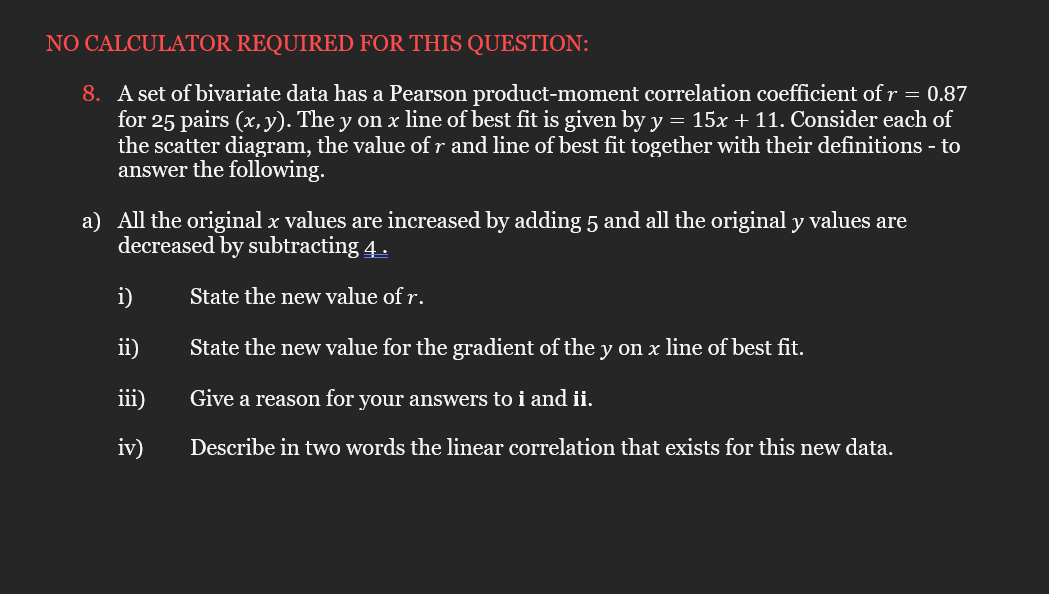
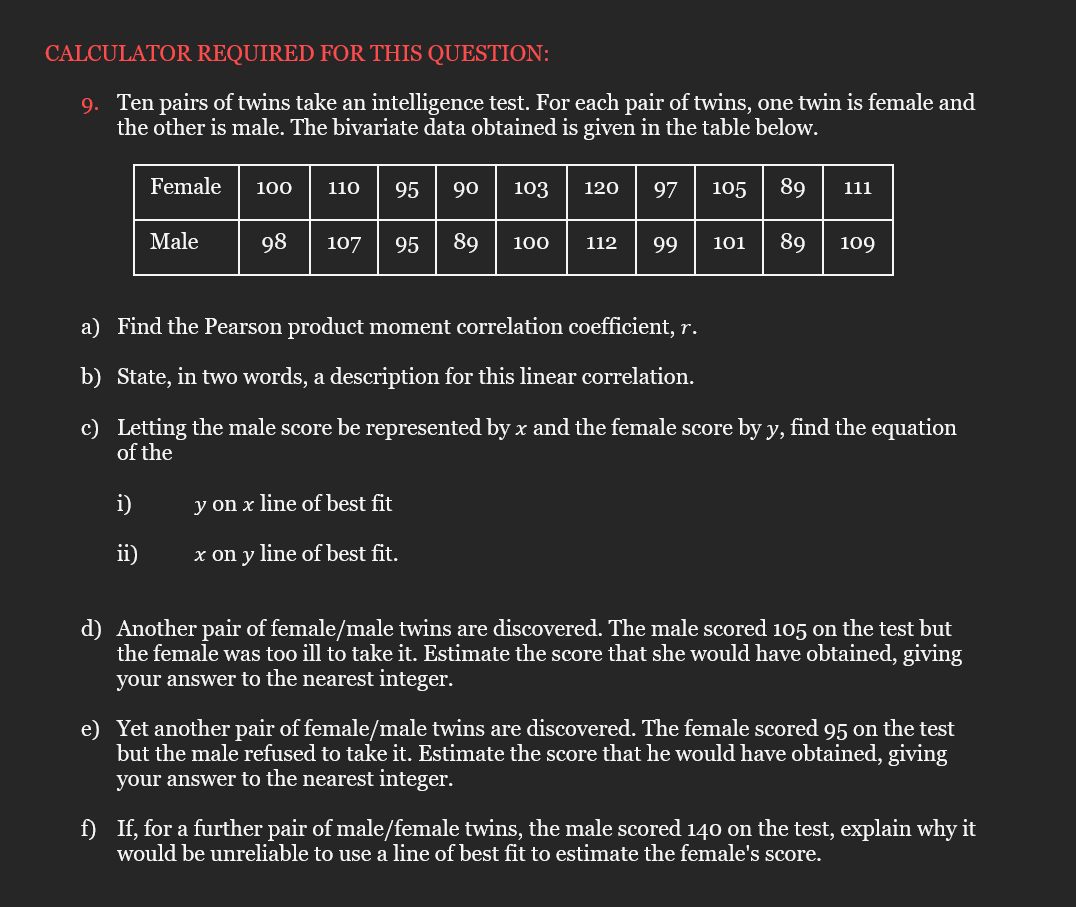
CALCULATOR REQUIRED FOR THIS QUESTION: 6. Sally and Rob both teach different Mathematics classes. In a test, Sally's students scored 1,1,4,7,8,8,10,10 In the same test, Rob's students scored: 4,4,4,5,6,6,10,10,10,10 a) For the data from Sally's class, find i) the median ii) the mean. b) For the data from Rob's class find i) the median ii) the mean. c) Give a reason why Sally could claim that her class performed better than Rob's class. d) Give a reason why Rob could claim that his class performed better than Sally's class.Paired, bivariate data (x, 32) that is strongly correlated has a y 011 x line of best t of the form y = mx + c. When 2: = 70 an estimate for y is 100. When x = 100 an estimate for y is 140 . a) Find the values of i) m ii) c. b) State if there is positive or negative correlation. e.) The value of :E is 90 . Find the value of 37. d) When 2: = 60 nd an estimate for the value of 3:, given that this is interpolation. NO CALCULATOR REQUIRED FOR THIS QUESTION: 8. A set of bivariate data has a Pearson product-moment correlation coefficient of r = 0.87 for 25 pairs (x, y). The y on x line of best fit is given by y = 15x + 11. Consider each of the scatter diagram, the value of r and line of best fit together with their definitions - to answer the following. a) All the original x values are increased by adding 5 and all the original y values are decreased by subtracting 4 . i) State the new value of r. ii) State the new value for the gradient of the y on x line of best fit. iii) Give a reason for your answers to i and ii. iv) Describe in two words the linear correlation that exists for this new data.CALCULATOR REQUIRED FOR THIS QUESTION: 9. Ten pairs of twins take an intelligence test. For each pair of twins, one twin is female and the other is male. The bivariate data obtained is given in the table below. Female 100 110 95 90 103 120 97 105 89 111 Male 98 107 95 89 100 112 99 101 89 109 a) Find the Pearson product moment correlation coefficient, r. b) State, in two words, a description for this linear correlation. c) Letting the male score be represented by x and the female score by y, find the equation of the i) y on x line of best fit ii) x on y line of best fit. d) Another pair of female/male twins are discovered. The male scored 105 on the test but the female was too ill to take it. Estimate the score that she would have obtained, giving your answer to the nearest integer. e) Yet another pair of female/male twins are discovered. The female scored 95 on the test but the male refused to take it. Estimate the score that he would have obtained, giving your answer to the nearest integer. f) If, for a further pair of male/female twins, the male scored 140 on the test, explain why it would be unreliable to use a line of best fit to estimate the female's score
Step by Step Solution
There are 3 Steps involved in it

Get step-by-step solutions from verified subject matter experts