

Question: please help me understand this The scatter plot below shows data for the value of a new mutual fund (y), in thousands of dollars, in
please help me understand this
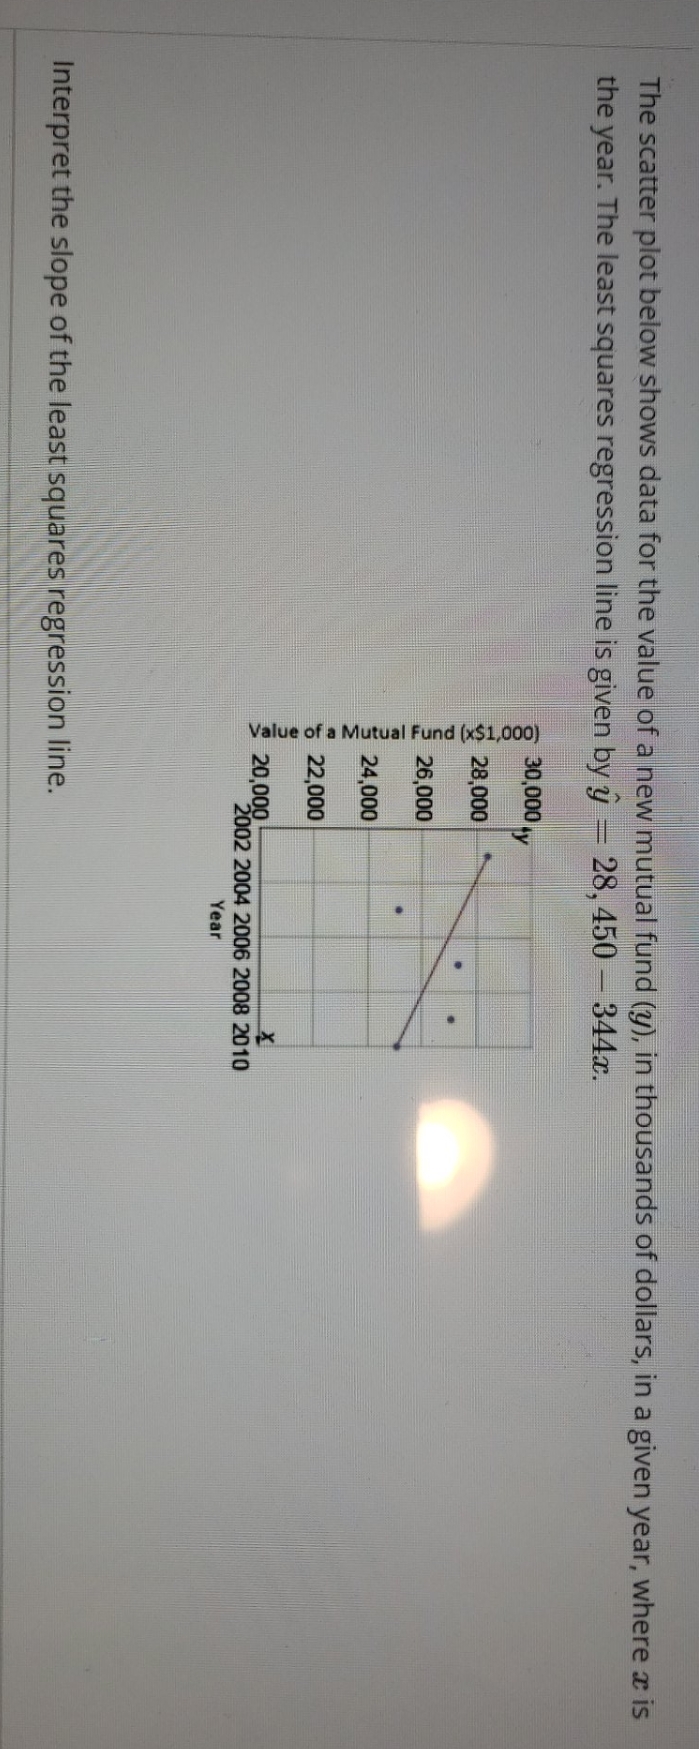
The scatter plot below shows data for the value of a new mutual fund (y), in thousands of dollars, in a given year, where x is the year. The least squares regression line is given by y - 28, 450 - 344x. Value of a Mutual Fund (x$1,000) 30,000 + 28,000 26,000 24,000 22,000 20,000 2002 2004 2006 2008 2010 Year Interpret the slope of the least squares regression line
Step by Step Solution
There are 3 Steps involved in it
1 Expert Approved Answer
Step: 1 Unlock

Question Has Been Solved by an Expert!
Get step-by-step solutions from verified subject matter experts
Step: 2 Unlock
Step: 3 Unlock