

Question: Please help me with below The accompanying table shows a list of the weights and costs of some turkeys at different supermarkets. Complete parts (a)
Please help me with below
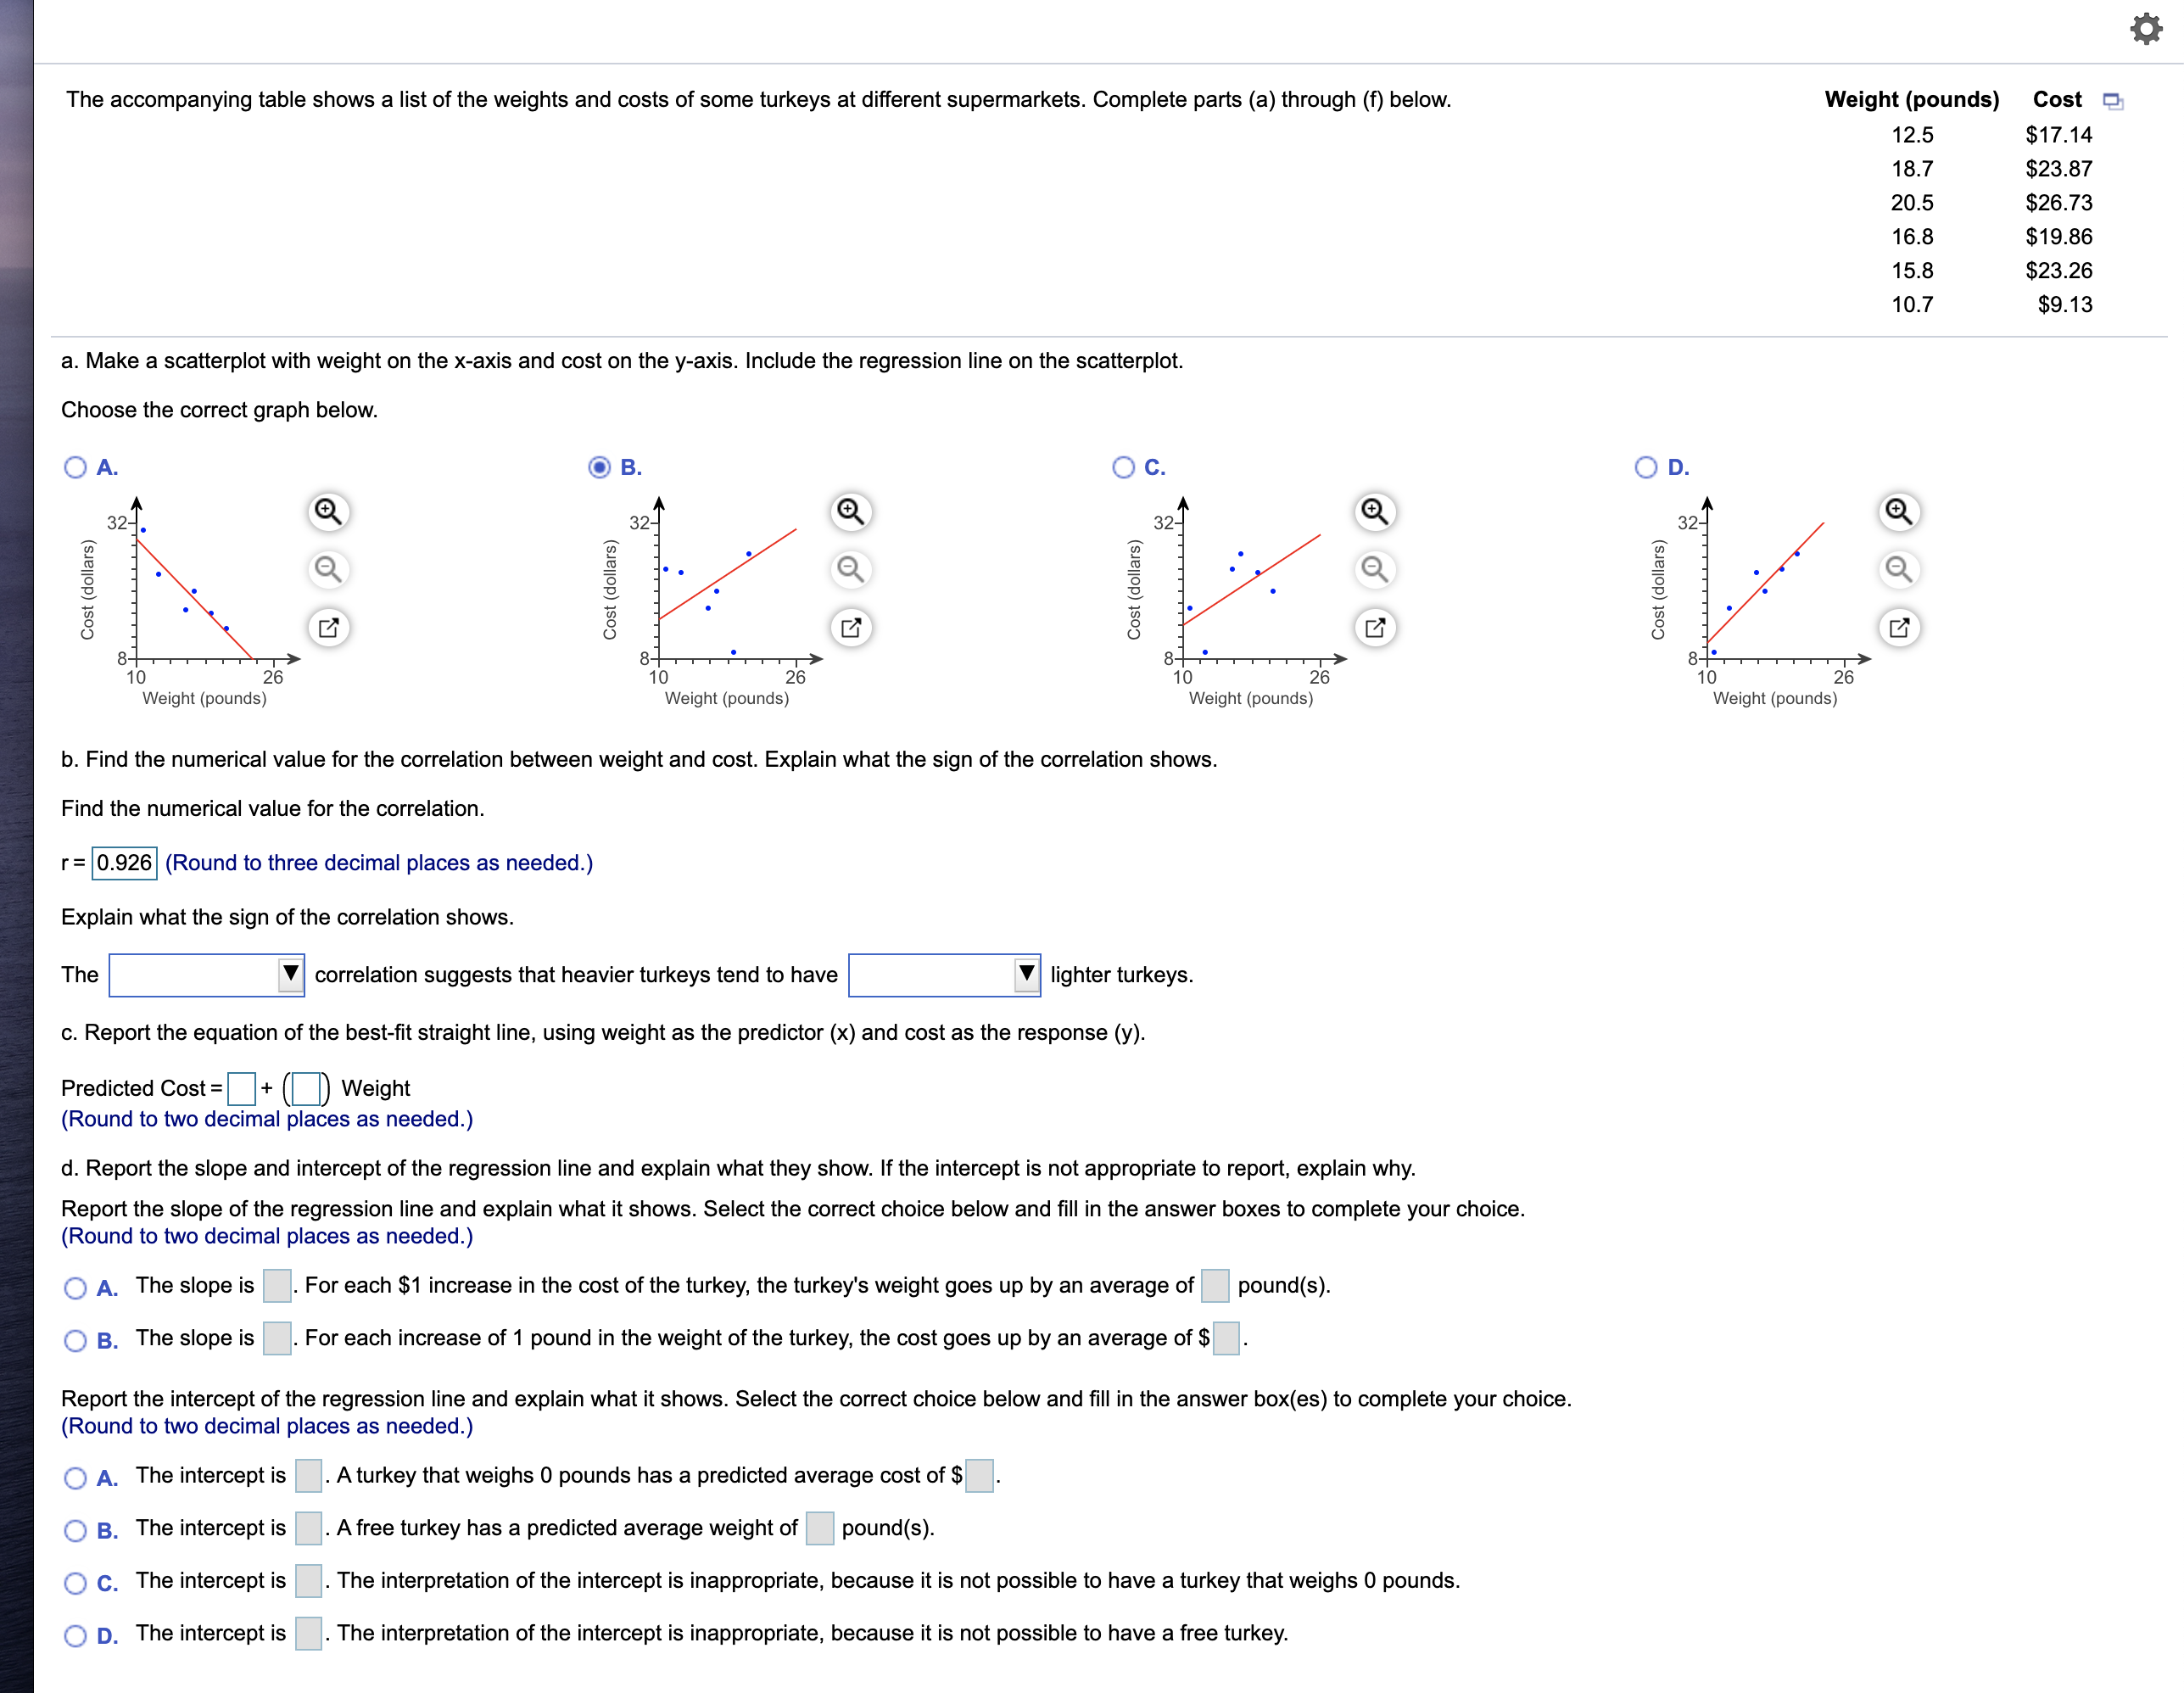
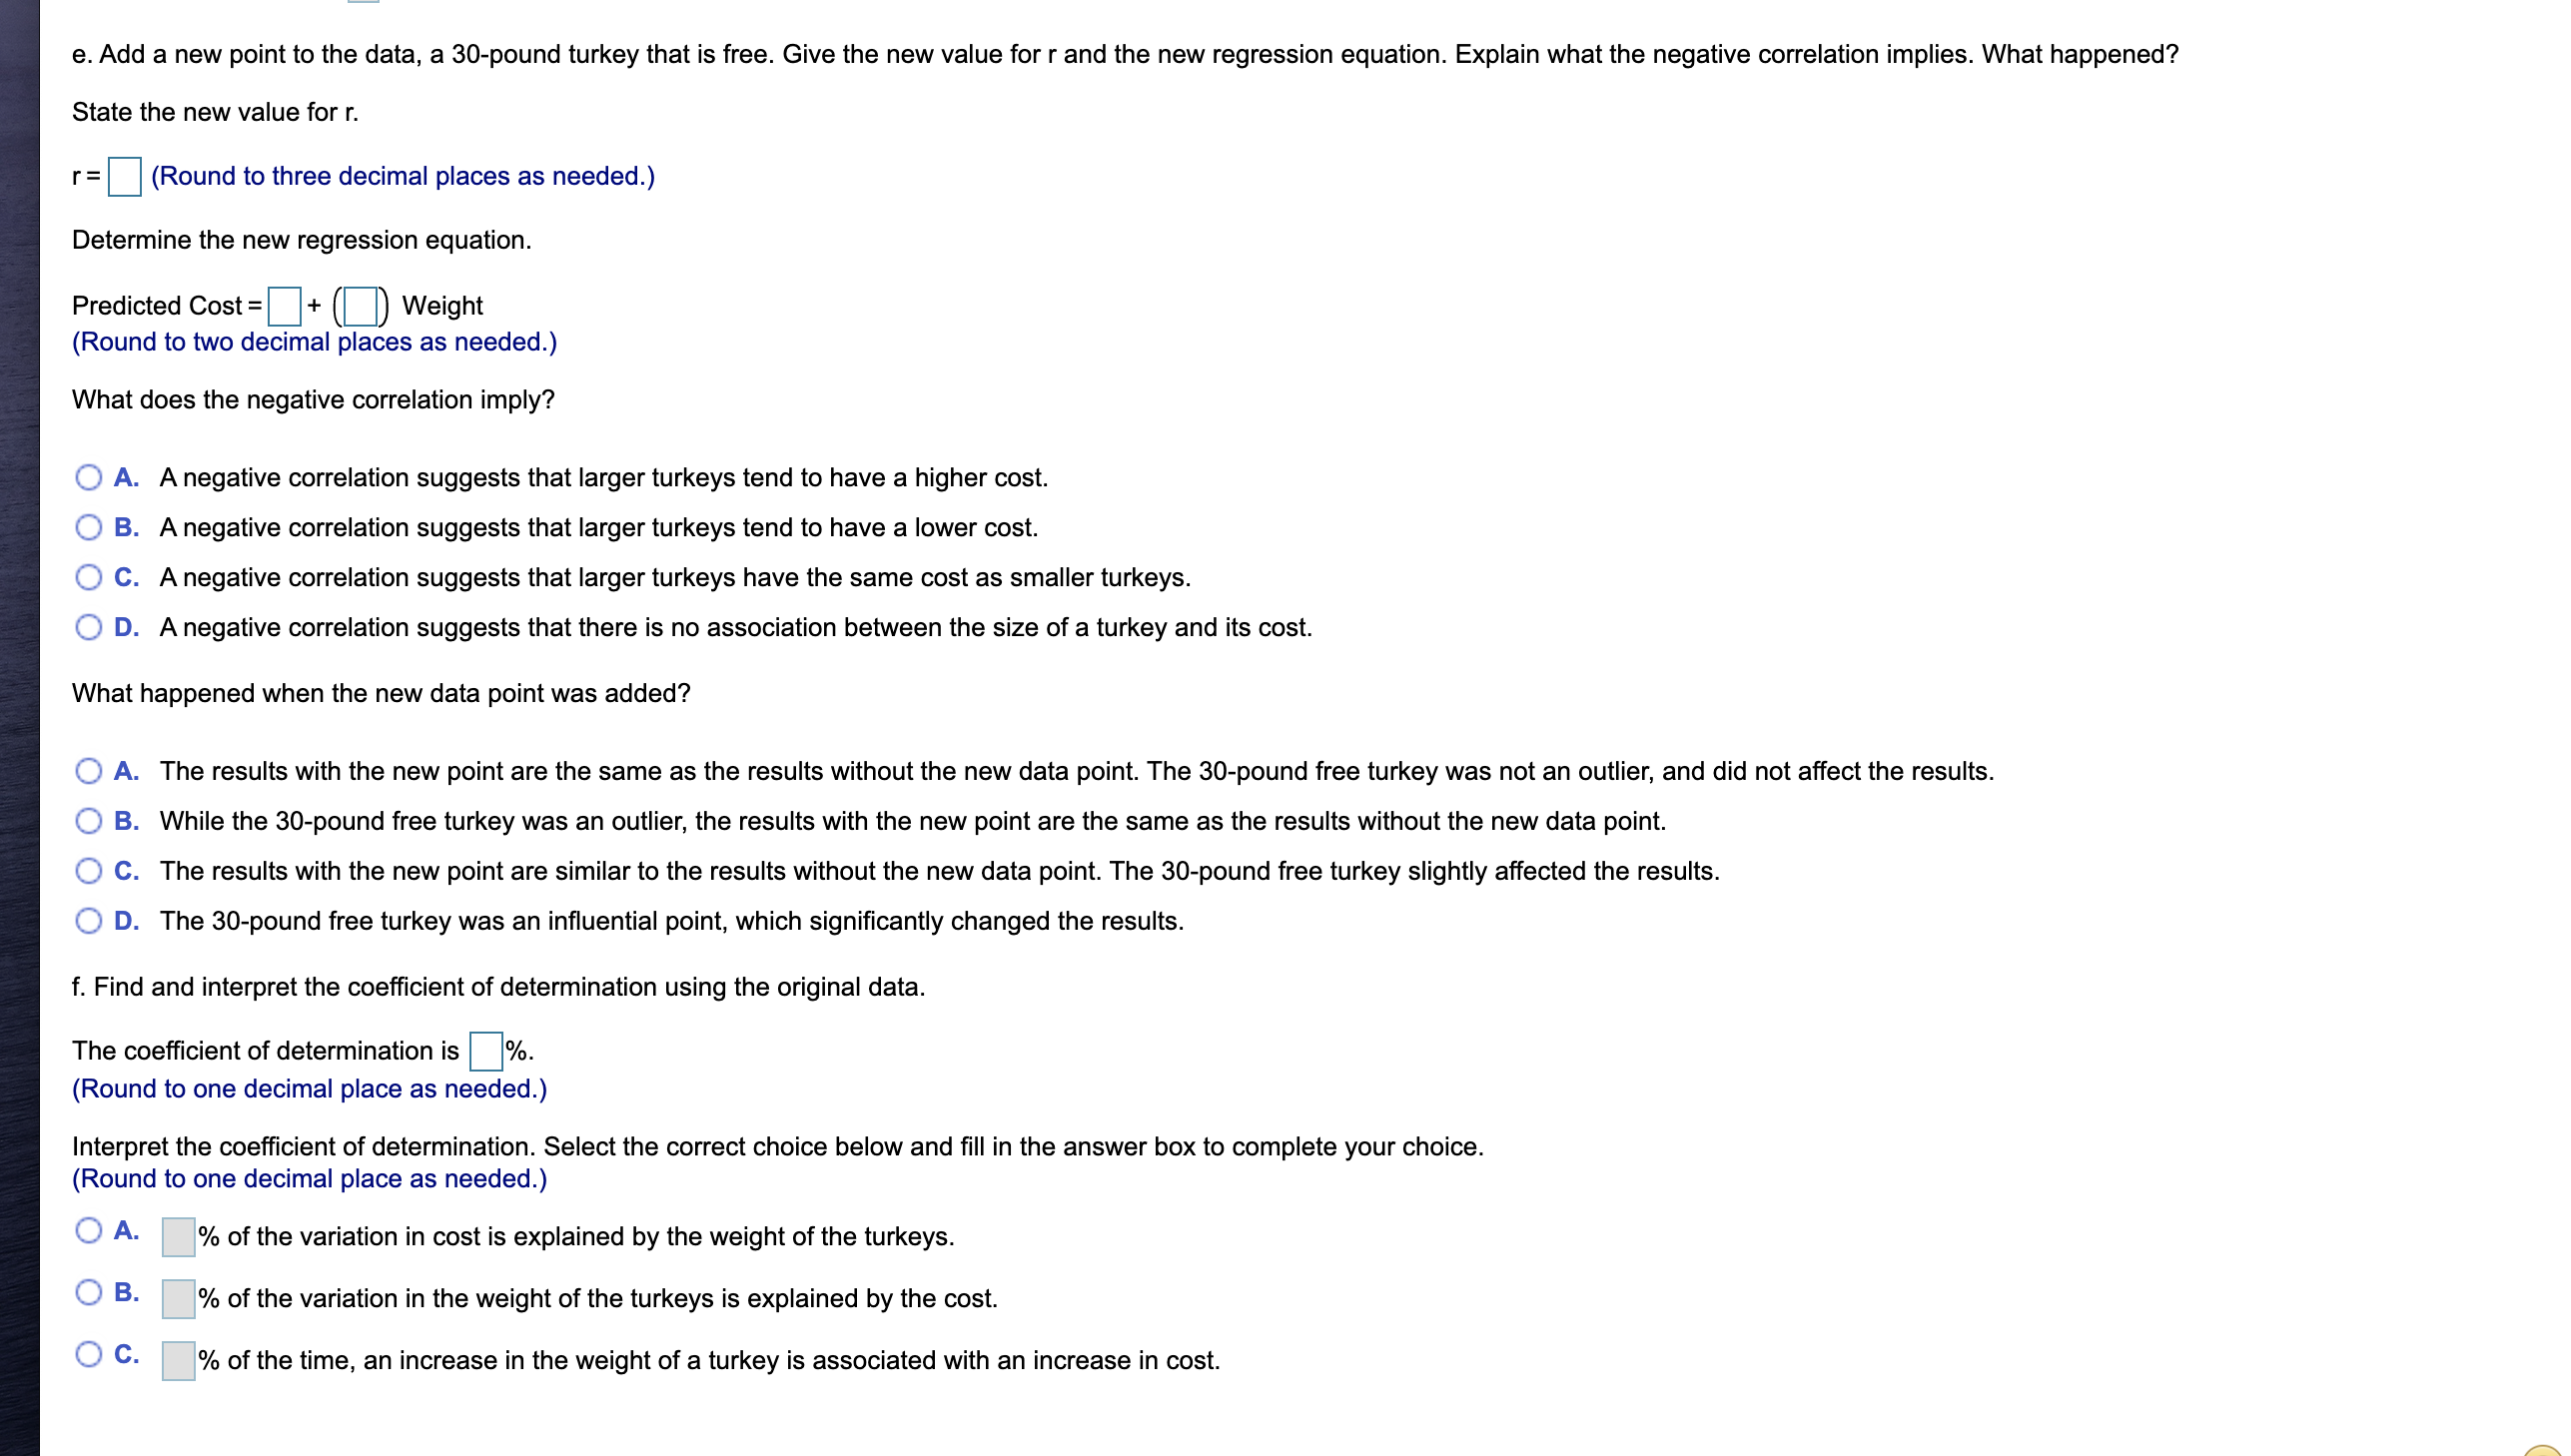
The accompanying table shows a list of the weights and costs of some turkeys at different supermarkets. Complete parts (a) through (0 below. a. Make a scatterplot with weight on the x-axis and cost on the yaxis. Include the regression line on the scatterplot. Choose the correct graph below. OA. (93. oc. Q a m m o) N I3 Cost (dollars) Cost (dollars) Cost (dollars) 8 10 26 10 26 10 26 Weight (pounds) Weight (pounds) Weight (pounds) b. Find the numerical value for the correlation between weight and cost. Explain what the sign of the correlation shows. Find the numerical value for the correlation. r= 0.926 (Round to three decimal places as needed.) Explain what the sign of the correlation shows. The V correlation suggests that heavier turkeys tend to have V lighter turkeys. 0. Report the equation of the best-t straight line, using weight as the predictor (x) and cost as the response (y). Predicted Cost = + Weight (Round to two decimal places as needed.) d. Report the slope and intercept of the regression line and explain what they show. If the intercept is not appropriate to report, explain why. Report the slope of the regression line and explain what it shows. Select the correct choice below and ll in the answer boxes to complete your choice. (Round to two decimal places as needed.) O A. The slope is . For each $1 increase in the cost of the turkey, the turkey's weight goes up by an average of pound(s). O B. The slope is . For each increase of 1 pound in the weight of the turkey, the cost goes up by an average of $ Report the intercept of the regression line and explain what it shows. Select the correct choice below and ll in the answer box(es) to complete your choice. (Round to two decimal places as needed.) O A. The intercept is . Aturkey that weighs 0 pounds has a predicted average cost of $ O B. The intercept is . Afree turkey has a predicted average weight of pound(s). O c, The intercept is . The interpretation of the intercept is inappropriate, because it is not possible to have a turkey that weighs 0 pounds. O D. The intercept is . The interpretation of the intercept is inappropriate, because it is not possible to have a free turkey. Cost (dollars) Weight (pounds) 1 O 26 Weight (pounds) 12.5 18.7 20.5 16.8 15.8 10.7 Cost $17.14 $23.87 $26.73 $19.86 $23.26 $9.13 E7 0* e. Add a new point to the data, a 30-pound turkey that is free. Give the new value for r and the new regression equation. Explain what the negative correlation implies. What happened? State the new value for r. r=(Round to three decimal places as needed.) Determine the new regression equation. Predicted Cost =+ () Weight Round to two decimal places as needed.) What does the negative correlation imply? O A. A negative correlation suggests that larger turkeys tend to have a higher cost. O B. A negative correlation suggests that larger turkeys tend to have a lower cost. O C. A negative correlation suggests that larger turkeys have the same cost as smaller turkeys. O D. A negative correlation suggests that there is no association between the size of a turkey and its cost. What happened when the new data point was added? O A. The results with the new point are the same as the results without the new data point. The 30-pound free turkey was not an outlier, and did not affect the results. O B. While the 30-pound free turkey was an outlier, the results with the new point are the same as the results without the new data point. O C. The results with the new point are similar to the results without the new data point. The 30-pound free turkey slightly affected the results. O D. The 30-pound free turkey was an influential point, which significantly changed the results. f. Find and interpret the coefficient of determination using the original data. The coefficient of determination is % (Round to one decimal place as needed.) Interpret the coefficient of determination. Select the correct choice below and fill in the answer box to complete your choice. Round to one decimal place as needed.) O A. % of the variation in cost is explained by the weight of the turkeys. O B. % of the variation in the weight of the turkeys is explained by the cost. O C. % of the time, an increase in the weight of a turkey is associated with an increase in cost
Step by Step Solution
There are 3 Steps involved in it

Get step-by-step solutions from verified subject matter experts