

Question: please help me with explanation G ng.cengage.com C MindTap - Cengage Learning + ng.cengage.com Mind Tap - Cengage Learning + Q Search this course ?
please help me with explanation
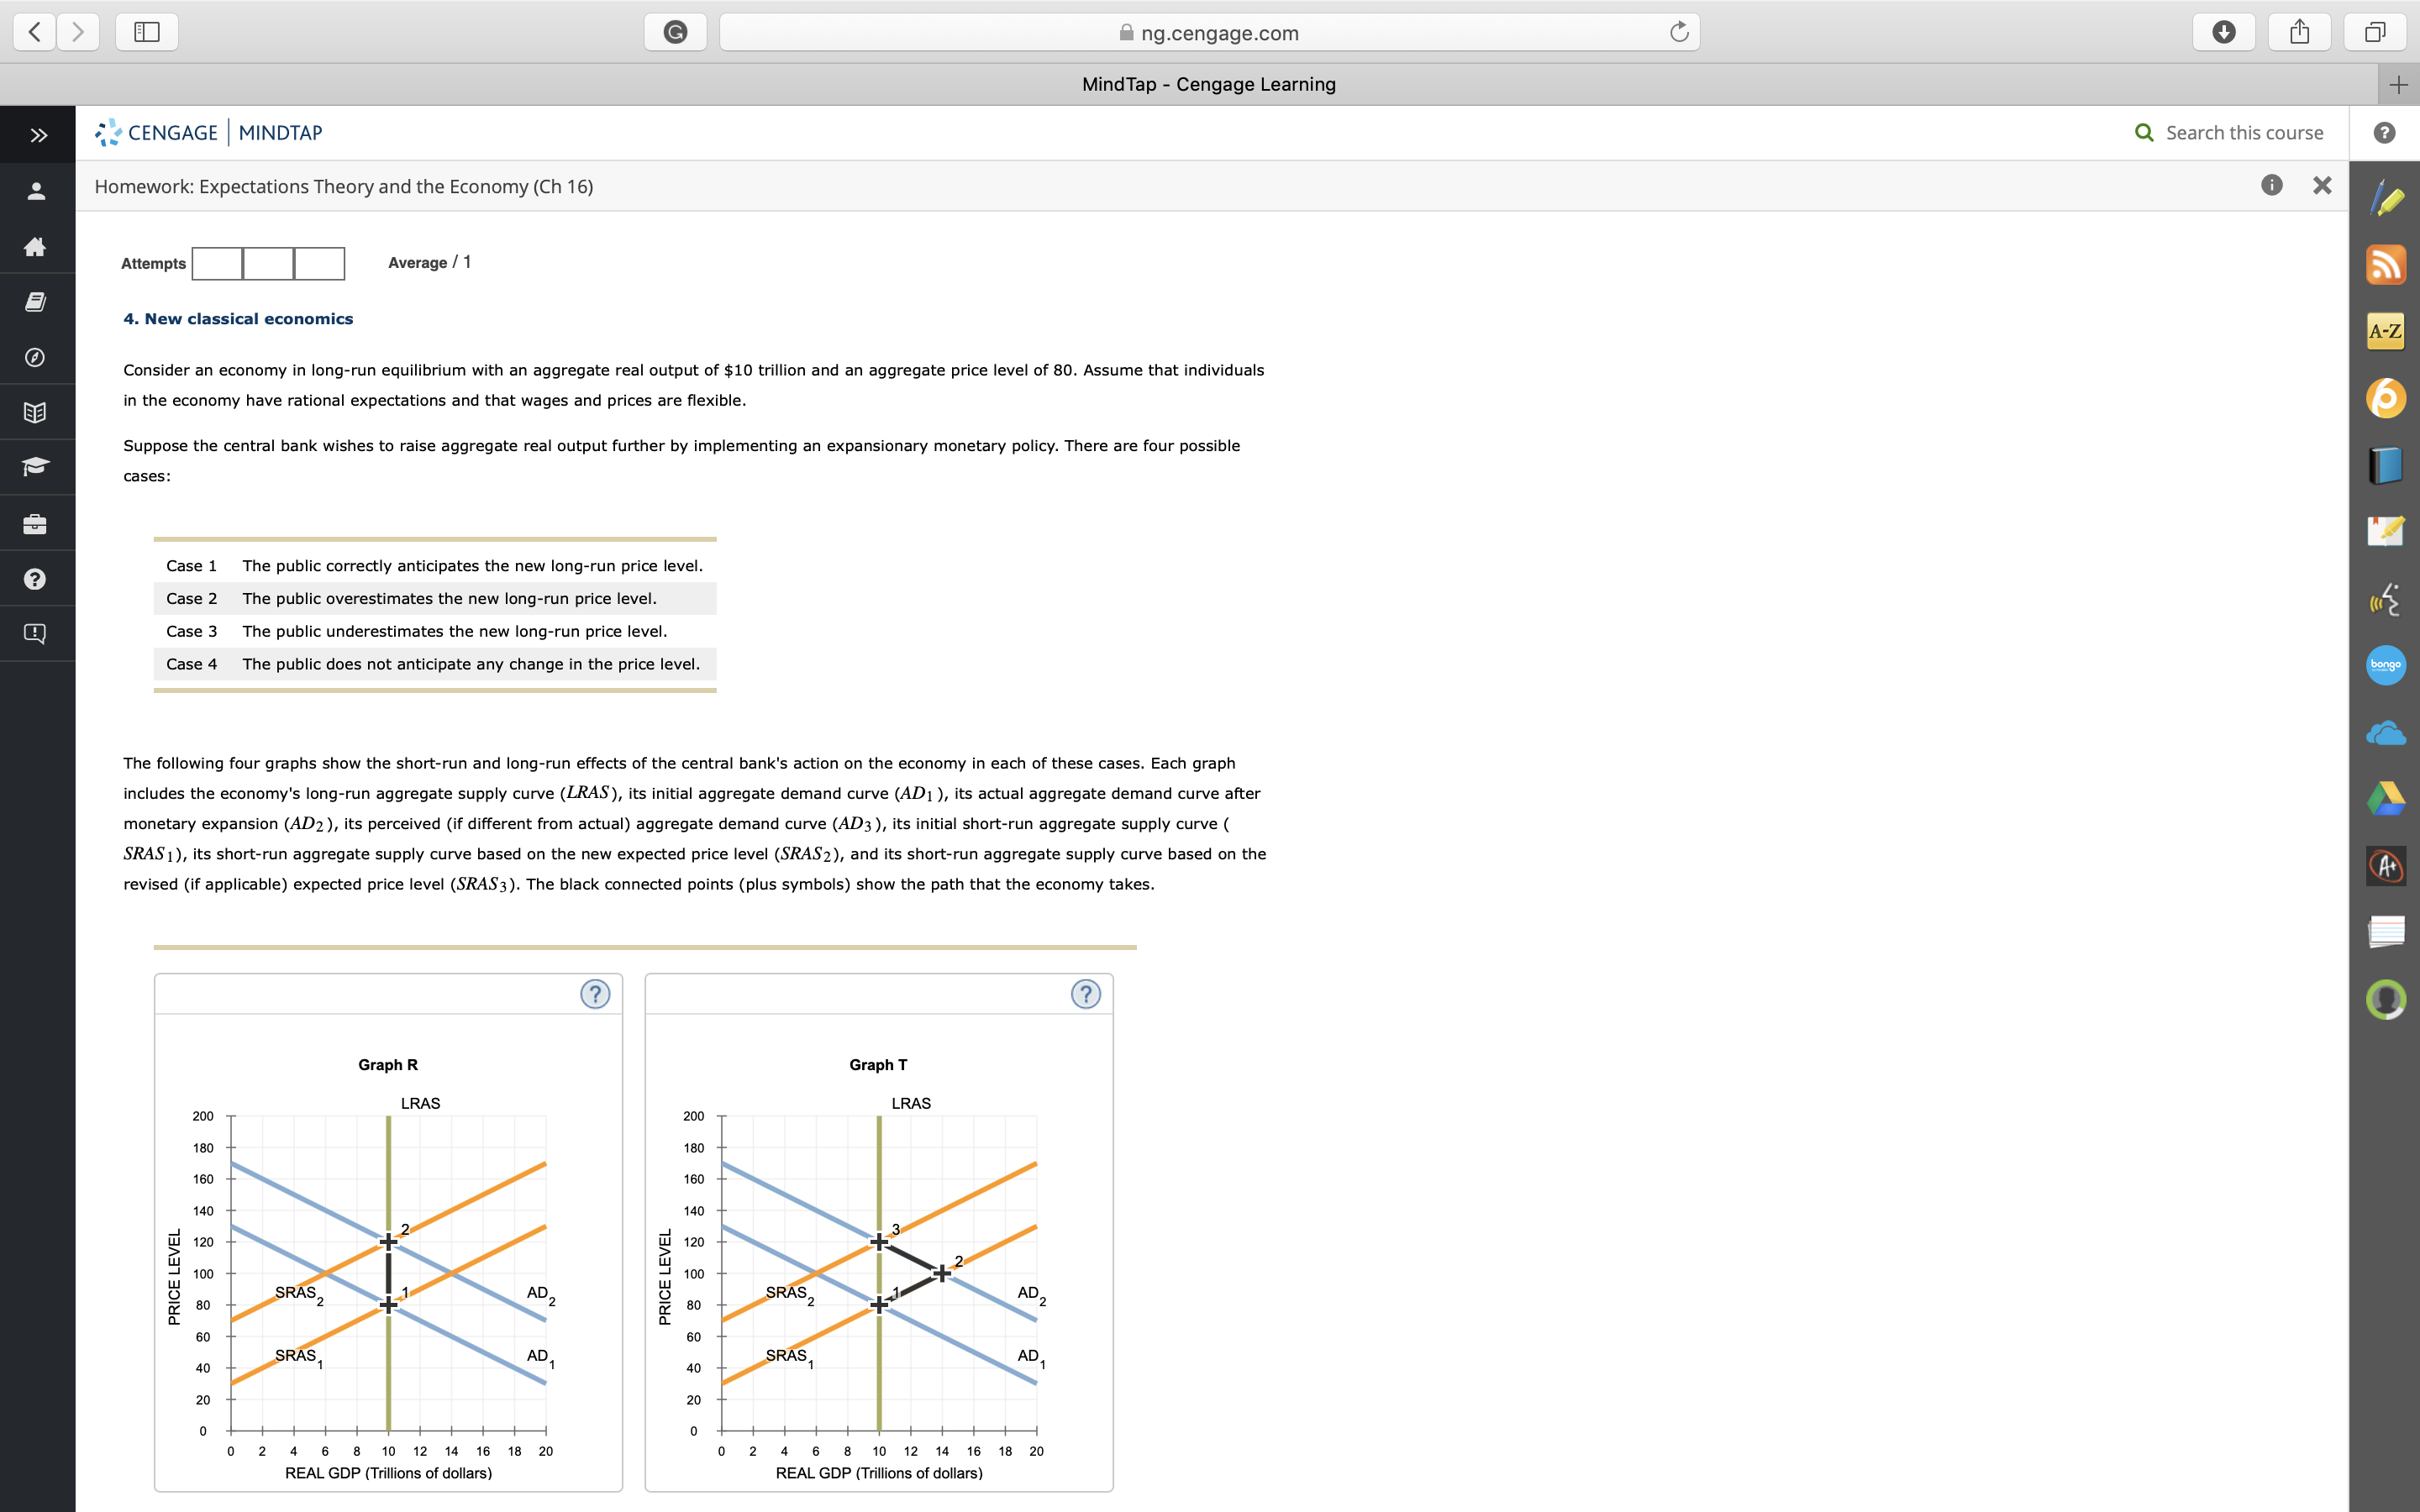
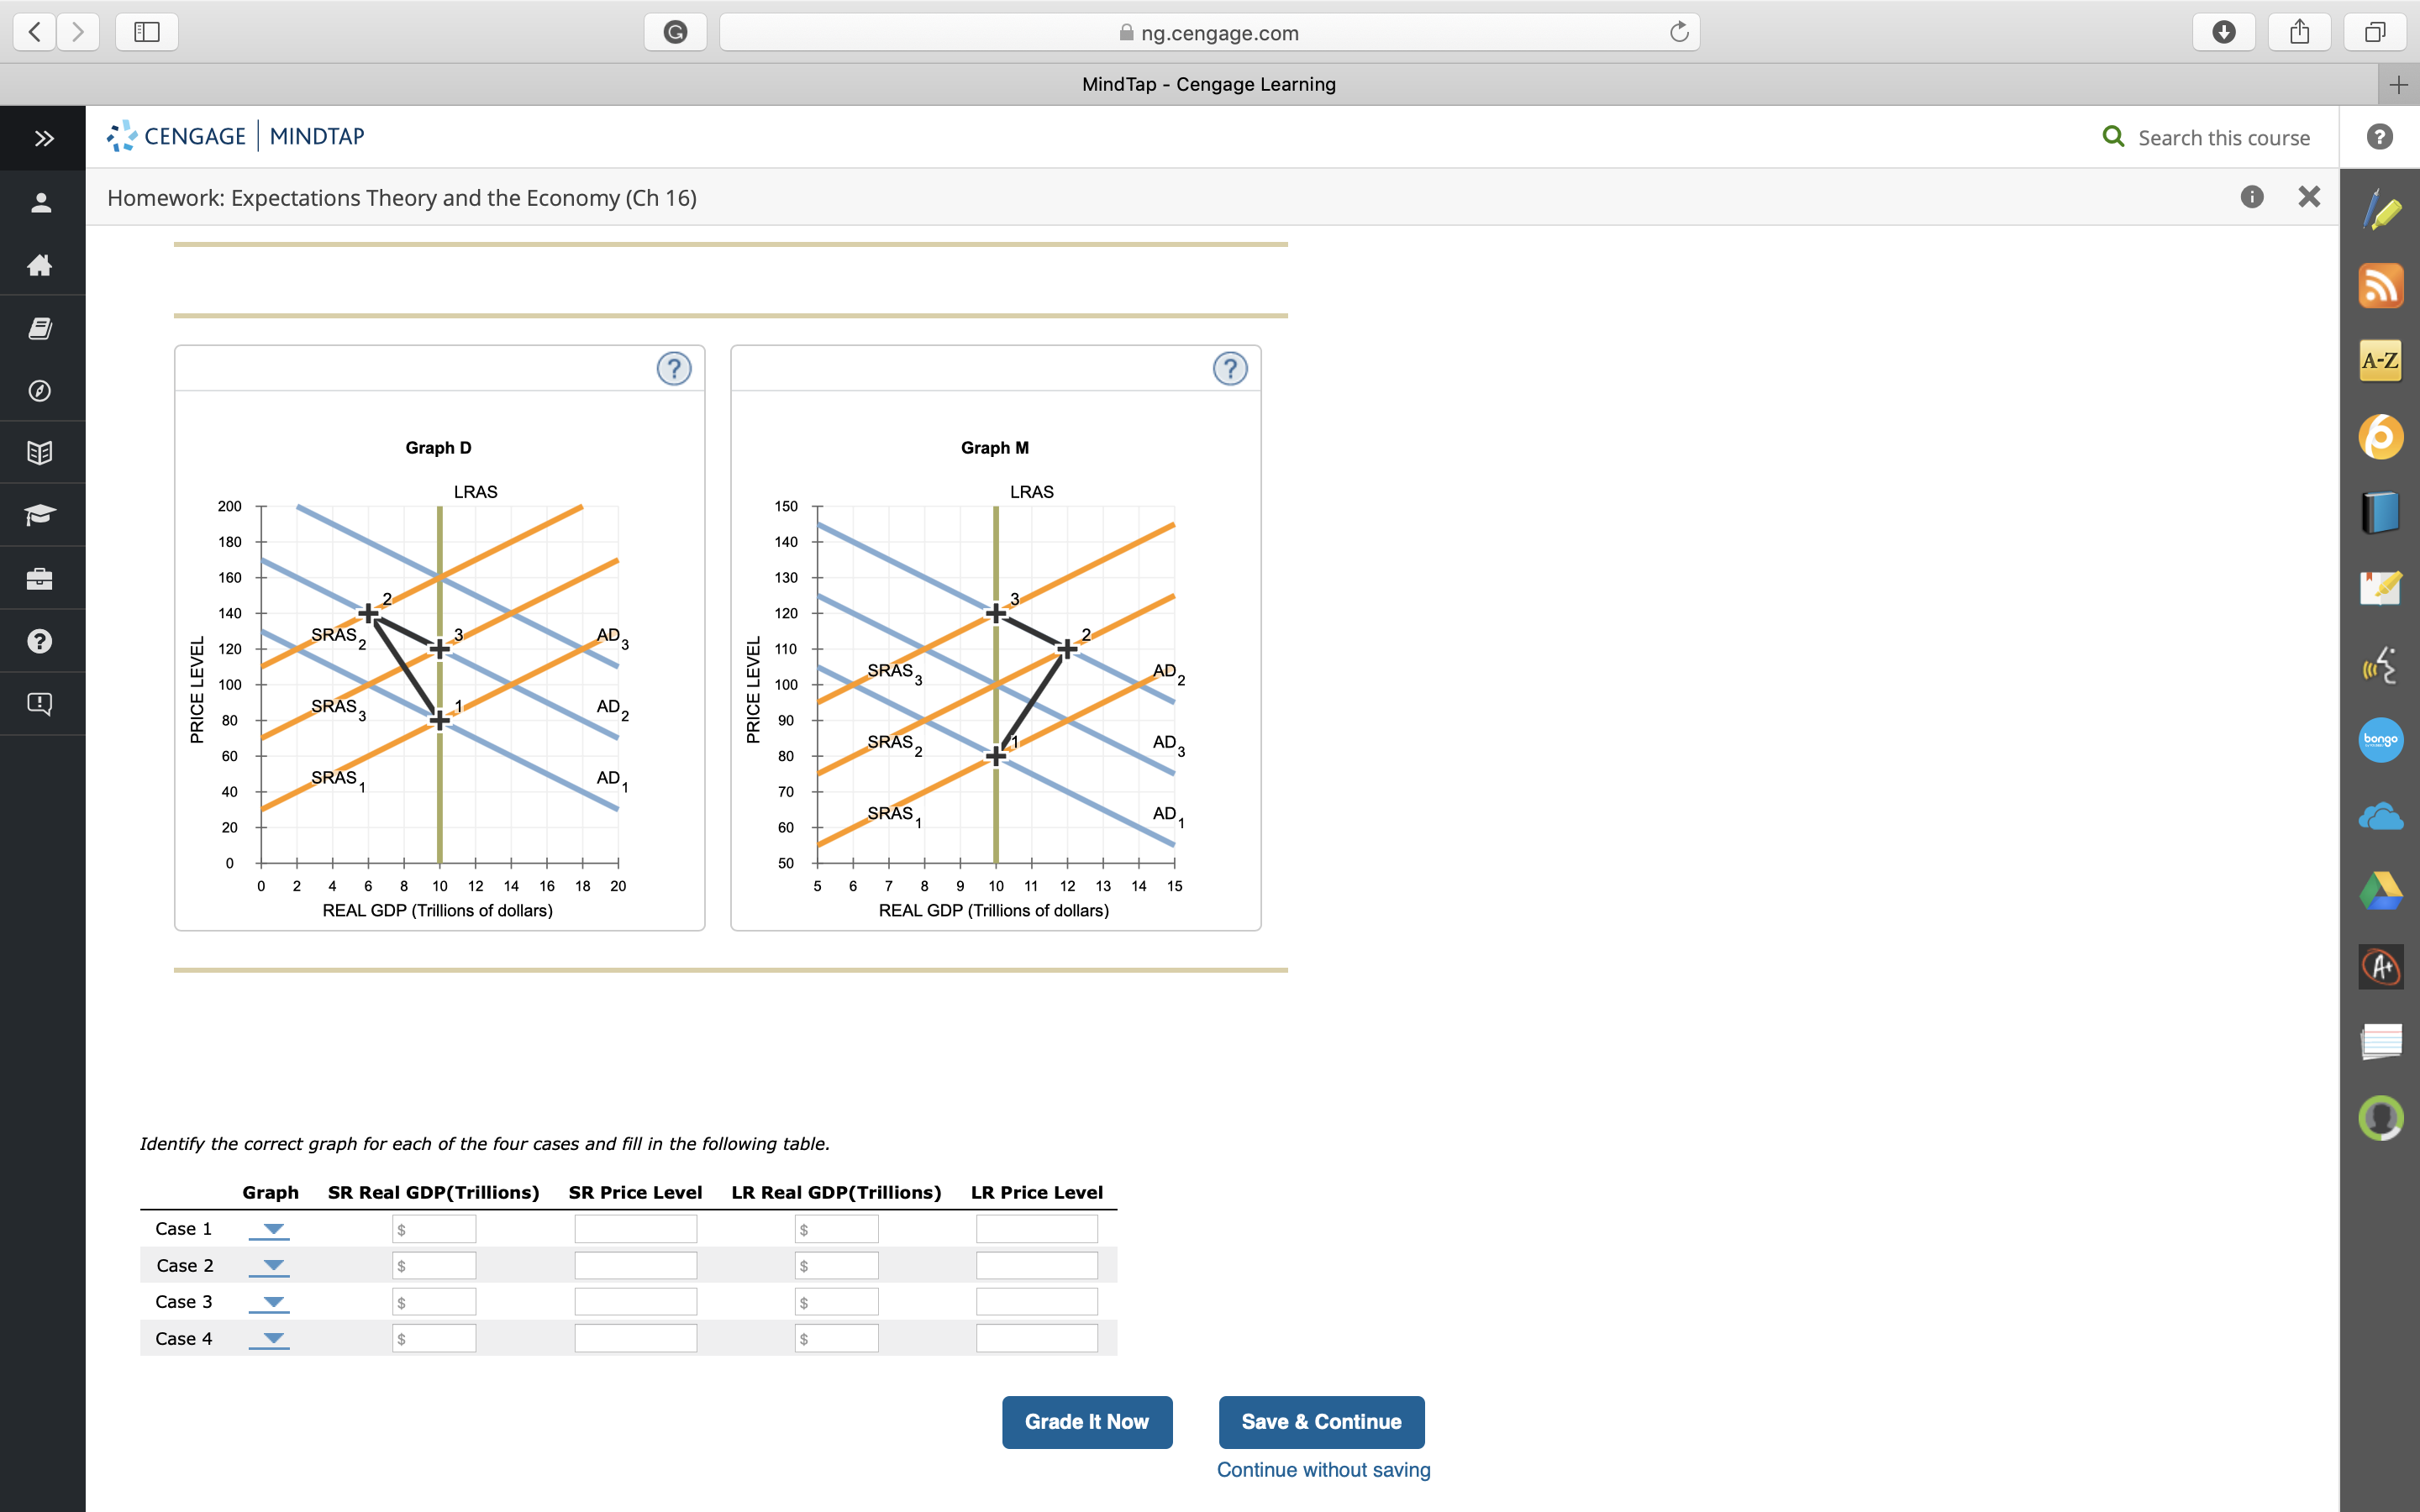
G ng.cengage.com C MindTap - Cengage Learning + ng.cengage.com Mind Tap - Cengage Learning + Q Search this course ? CENGAGE | MINDTAP X . Homework: Expectations Theory and the Economy (Ch 16) E A-Z ? (?) Graph D Graph M LRAS LRAS 200 150 140 130 120 SRAS 2 AD ? 2 ? 110 SRAS 3 AD 2 PRICE LEVEL 100 PRICE LEVEL 0 8 8 8 8 8 5 8 9 8 SRAS 3 AD 2 8 bongo SRAS 2 AD 3 AD , 8 8 SRAS 1 60 SRAS AD 50 2 4 6 8 10 12 14 16 18 5 6 7 8 9 10 11 12 13 14 REAL GDP (Trillions of dollars) REAL GDP (Trillions of dollars) A+ Identify the correct graph for each of the four cases and fill in the following table. Graph SR Real GDP(Trillions) SR Price Level LR Real GDP(Trillions) LR Price Level Case 1 Case 2 Case 3 Case 4 Grade It Now Save & Continue Continue without saving
Step by Step Solution
There are 3 Steps involved in it

Get step-by-step solutions from verified subject matter experts