

Question: Please help me with part 5 a & b. The table shows the total receipts R and total expenditures E for the Social Security Trust
Please help me with part 5 a & b.
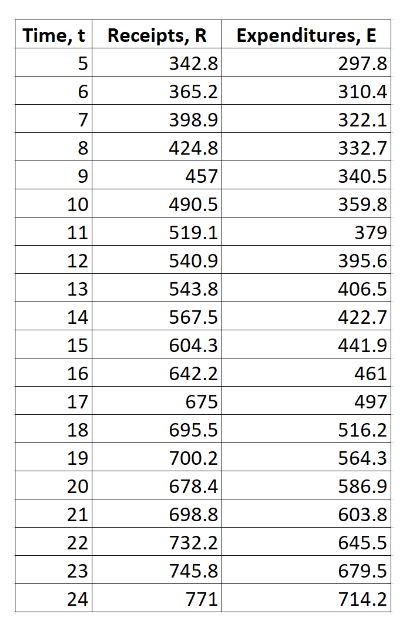
The table shows the total receipts R and total expenditures E for the Social Security Trust Fund in billions of dollars. The time t is given in years, with t = 5 corresponding to 1995. 1. Use Microsoft Excel or Google Sheets to... a. Plot the receipts and expenditures per year on one scatterplot graph. b. Fit a linear model to the data for receipts R as a function of the time t. Choose the option to display the equation on the graph. c. Fit an exponential model to the data for expenditures E as a function of the time t. Choose the option to display the equation on the graph. Show a screen capture of the graph DISPLAYING BOTH EQUATIONS in your project. 2. Assume the models can be used for the years 2015 through 2020. a. What values of t correspond to these years? b. Use integration to approximate the surplus revenue generated during those years. SHOW YOUR WORK, typed in proper notation in Microsoft Word or Google Docs. 3. Will the models found in parts 1b and 1c intersect in future years? a. Using graphing software (recommend Desmos.com), find what year the models will intersect. Show a screen capture of the graph with the intersection point highlighted in your project. b. Write a sentence to interpret this point (like In the year ... , this is what will happen...)
4. Use integration to approximate the surplus revenue generated from 1995 until the year that you found in part 3. To speed up your work, you can enter the antiderivative as a function into Desmos, and use Desmos to quickly evaluate the antiderivative at the necessary years. Show a screen capture of your work in Desmos 5. Into the future... a. What happens to the surplus revenue as you integrate from 1995 to years further and further out beyond the year that you found in part 3? Why is this happening? b. The big question... When will the Social Security Trust Fund be empty? You do not need to solve for the answer analytically (like solving an equation), use whatever method (like using a graph or trial-and-error) to find the answer. Explain the answer AND how you found the answer.
Expenditures, E 297.8 310.4 322.1 332.7 340.5 359.8 379 395.6 9 Time,t Receipts, R 5 342.8 6 365.2 7 398.9 8 424.8 9 457 10 490.5 11 519.1 12 540.9 13 543.8 14 567.5 15 604.3 16 642.2 17 675 18 695.5 19 700.2 20 678.4 21 698.8 22 732.2 23 745.8 24 771 406.5 422.7 441.9 461 497 516.2 564.3 586.9 603.8 645.5 679.5 714.2 Expenditures, E 297.8 310.4 322.1 332.7 340.5 359.8 379 395.6 9 Time,t Receipts, R 5 342.8 6 365.2 7 398.9 8 424.8 9 457 10 490.5 11 519.1 12 540.9 13 543.8 14 567.5 15 604.3 16 642.2 17 675 18 695.5 19 700.2 20 678.4 21 698.8 22 732.2 23 745.8 24 771 406.5 422.7 441.9 461 497 516.2 564.3 586.9 603.8 645.5 679.5 714.2
Step by Step Solution
There are 3 Steps involved in it

Get step-by-step solutions from verified subject matter experts