

Question: Please help me with part (b) my UCLx is wrong. Here are my calculations please give me a detailed calculation. Refer to Table 56.1 -
Please help me with part (b)
my UCLx is wrong. Here are my calculations
please give me a detailed calculation.
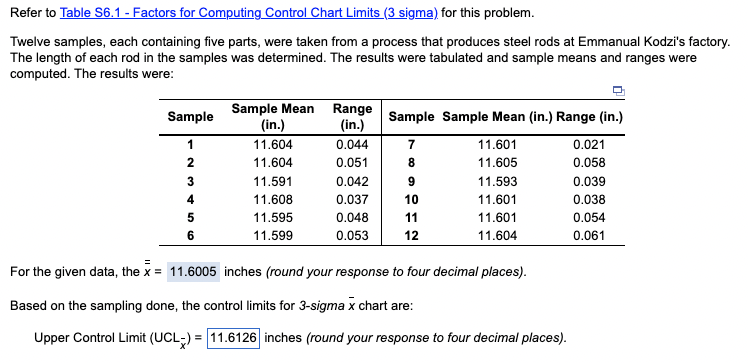
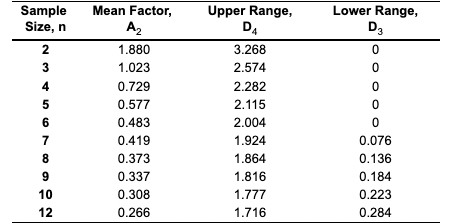
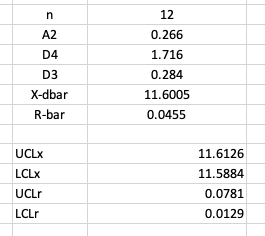
Refer to Table 56.1 - Factors for Computing Control Chart Limits (3 sigma) for this problem. Twelve samples, each containing five parts, were taken from a process that produces steel rods at Emmanual Kodzi's factory. The length of each rod in the samples was determined. The results were tabulated and sample means and ranges were computed. The results were: Sample 1 2 3 Sample Mean Range (in.) (in.) 11.604 0.044 11.604 0.051 11.591 0.042 11.608 0.037 11.595 0.048 11.599 0.053 Sample Sample Mean (in.) Range (in.) 7 11.601 0.021 8 11.605 0.058 9 11.593 0.039 10 11.601 0.038 11 11.601 0.054 12 11.604 0.061 4 5 6 For the given data, the x = 11.6005 inches (round your response to four decimal places). Based on the sampling done, the control limits for 3-sigma x chart are: Upper Control Limit (UCLJ) = 11.6126 inches (round your response to four decimal places). = Lower Range, D3 Sample Size, n 2 3 4 5 6 7 8 8 9 9 10 + Mean Factor, Az 1.880 1.023 0.729 0.577 0.483 0.419 0.373 0.337 0.308 0.266 Upper Range, D4 3.268 2.574 2.282 2.115 2.004 1.924 1.864 1.816 1.777 1.716 0 0 0 0 0 0.076 0.136 0.184 0.223 0.284 00 12 n A2 12 0.266 1.716 D4 D3 0.284 11.6005 X-dbar R-bar 0.0455 UCLX LCLX UCLr LCLT 11.6126 11.5884 0.0781 0.0129Step by Step Solution
There are 3 Steps involved in it
1 Expert Approved Answer
Step: 1 Unlock

Question Has Been Solved by an Expert!
Get step-by-step solutions from verified subject matter experts
Step: 2 Unlock
Step: 3 Unlock