

Question: Please show how to solve step by step Assignments Do Homework - Ch.S6-SPC C Refer To Table 56.1 - Factors F x Gateway - SF
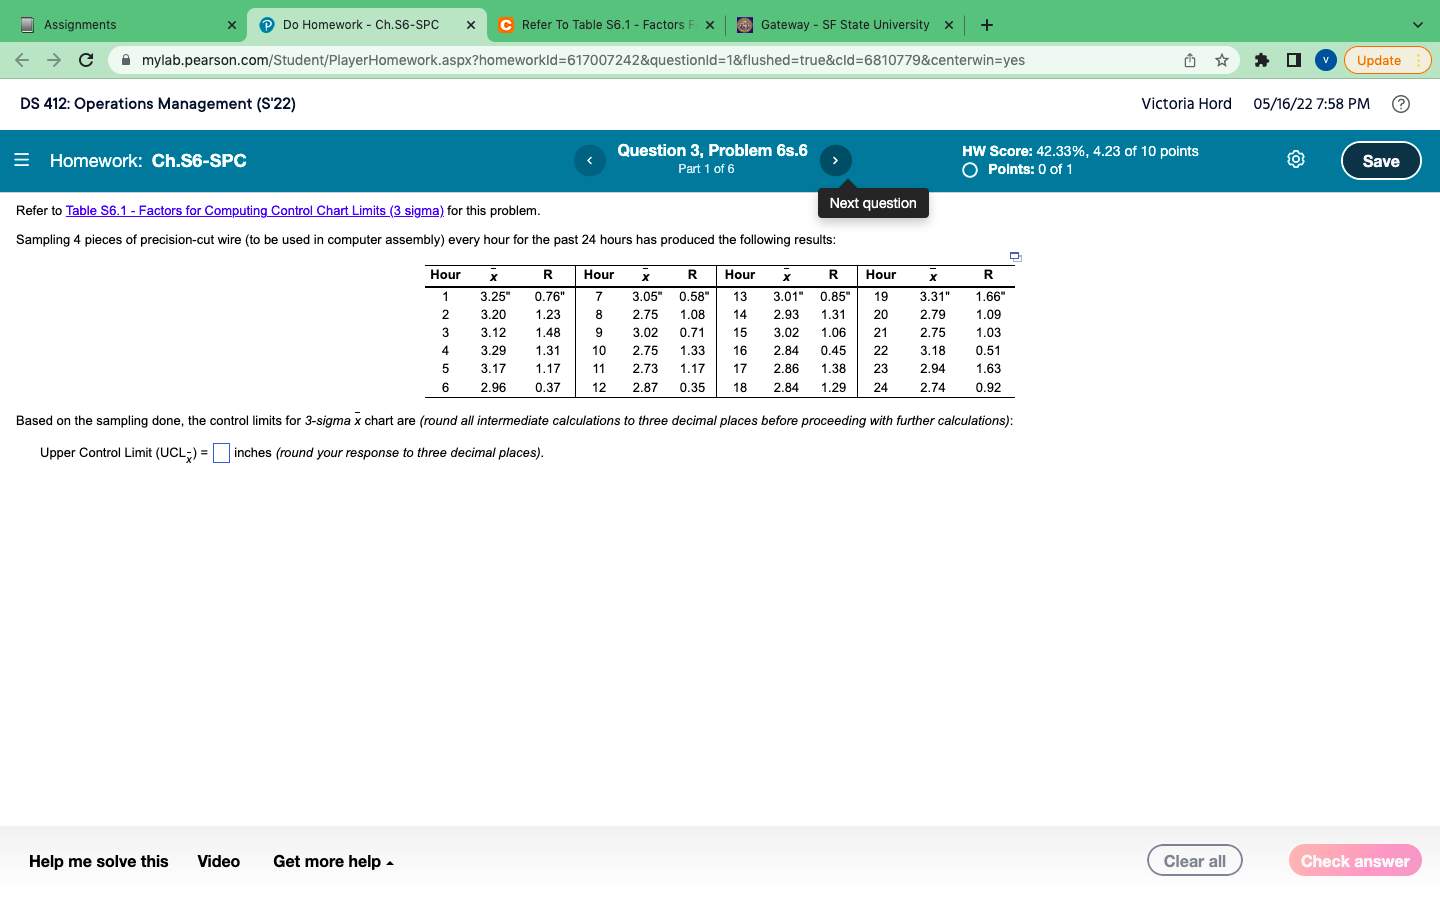 Please show how to solve step by step
Step by Step Solution
There are 3 Steps involved in it
1 Expert Approved Answer
Step: 1 Unlock

Question Has Been Solved by an Expert!
Get step-by-step solutions from verified subject matter experts
Step: 2 Unlock
Step: 3 Unlock