

Question: ***Please help me with Part E and explain to me. Thank you so much! Your client's cinema has 1 BASIC THEATRE ROOM ONLY Cinema capacity:
***Please help me with Part E and explain to me. Thank you so much!
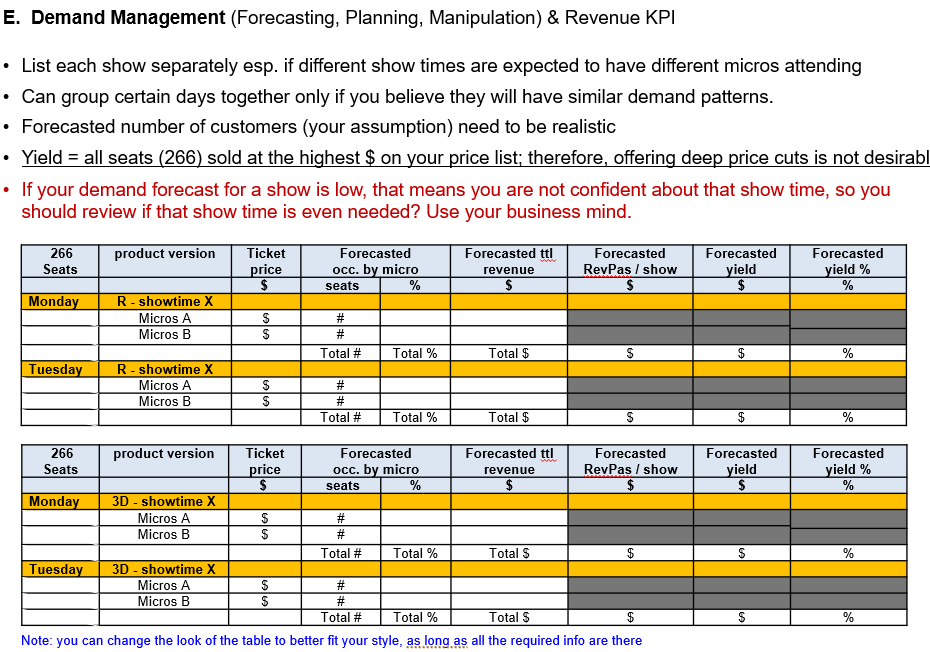
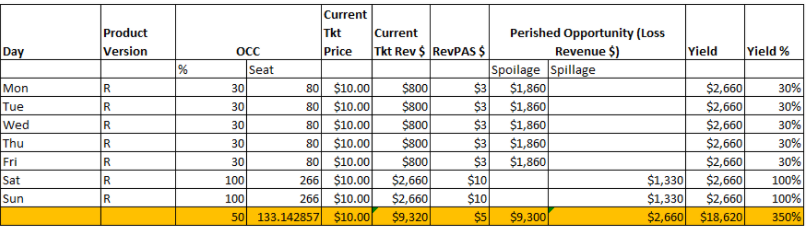
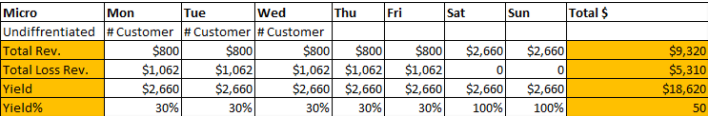
Your client's cinema has 1 BASIC THEATRE ROOM ONLY Cinema capacity: 266 seats Occupancy: Wkd: 30% Ticket Price: $10 Product Version: 1 Regular show/day @7pm Wkn: sold out early with 50% consumer surplus (spillage); overcrowded Propose: 7-day RM strategy for a regular week (Monday - Sunday) to max PRO Product Version Day % R R Mon Tue Wed Thu Fri Sat Sun Current Tkt Current Perished Opportunity (Loss OCC Price Tkt Rev $ RevPASS Revenue $) Yield Yield % Seat Spoilage Spillage 30 80 $10.00 $800 $3 $1,860 $2,660 30% 30 80 $10.00 $800 $3 $1,860 $2,660 30% 30 80 $10.00 $800 $3 $1,860 $2,660 30% 30 80 $10.00 $800 $3 $1,860 $2,660 30% 30 80 $10.00 $800 $3 $1,860 $2,660 30% 100 266 $10.00 $2,660 $10 $1,330 $2,660 100% 100 266 $10.00 $2,660 $10 $1,330 $2,660 100% 50 133.142857 $10.00 $9,320 $5 $9,300 $2,660 $18,620 350% R R R R R Micro Mon Tue Wed Thu Fri Sat Sun Total $ Undiffrentiated # Customer #Customer #Customer Total Rev. $800 $800 $800 $800 $800 $2,660 $2,660 Total Loss Rev. $1,062 $1,0621 $1,062 $1,062 $1,062 0 0 Yield $2,660 $2,660 $2,660 $2,660 $2,660 $2,660 $2,660 Yield% 30% 30% 30% 30% 100% 100% $9,320 $5,310 $18,620 50 30% E. Demand Management (Forecasting, Planning, Manipulation) & Revenue KPI List each show separately esp. if different show times are expected to have different micros attending Can group certain days together only if you believe they will have similar demand patterns. Forecasted number of customers (your assumption) need to be realistic Yield = all seats (266) sold at the highest $ on your price list; therefore, offering deep price cuts is not desirabl If your demand forecast for a show is low, that means you are not confident about that show time, so you should review if that show time is even needed? Use your business mind. 266 Seats product version Ticket price $ Forecasted occ. by micro seats % Forecasted tt! revenue Forecasted RevPas / show $ Forecasted yield Forecasted yield % % $ Monday R-showtime X Micros A Micros B # # $ Total # Total % Total $ $ $ % Tuesday R-showtime X Micros A Micros B $ $ # # Total # Total % Total $ $ $ % Forecasted yield $ Forecasted yield % % 266 product version Ticket Forecasted Forecasted tt Forecasted Seats price occ. by micro revenue RevPas / show $ seats % $ $ Monday 3D - showtime X Micros A S # Micros B S # Total # Total % Total $ Tuesday 3D - showtime X Micros A S # Micros B $ # Total # Total % Total $ Note: you can change the look of the table to better fit your style, as long as all the required info are there $ % $ % Your client's cinema has 1 BASIC THEATRE ROOM ONLY Cinema capacity: 266 seats Occupancy: Wkd: 30% Ticket Price: $10 Product Version: 1 Regular show/day @7pm Wkn: sold out early with 50% consumer surplus (spillage); overcrowded Propose: 7-day RM strategy for a regular week (Monday - Sunday) to max PRO Product Version Day % R R Mon Tue Wed Thu Fri Sat Sun Current Tkt Current Perished Opportunity (Loss OCC Price Tkt Rev $ RevPASS Revenue $) Yield Yield % Seat Spoilage Spillage 30 80 $10.00 $800 $3 $1,860 $2,660 30% 30 80 $10.00 $800 $3 $1,860 $2,660 30% 30 80 $10.00 $800 $3 $1,860 $2,660 30% 30 80 $10.00 $800 $3 $1,860 $2,660 30% 30 80 $10.00 $800 $3 $1,860 $2,660 30% 100 266 $10.00 $2,660 $10 $1,330 $2,660 100% 100 266 $10.00 $2,660 $10 $1,330 $2,660 100% 50 133.142857 $10.00 $9,320 $5 $9,300 $2,660 $18,620 350% R R R R R Micro Mon Tue Wed Thu Fri Sat Sun Total $ Undiffrentiated # Customer #Customer #Customer Total Rev. $800 $800 $800 $800 $800 $2,660 $2,660 Total Loss Rev. $1,062 $1,0621 $1,062 $1,062 $1,062 0 0 Yield $2,660 $2,660 $2,660 $2,660 $2,660 $2,660 $2,660 Yield% 30% 30% 30% 30% 100% 100% $9,320 $5,310 $18,620 50 30% E. Demand Management (Forecasting, Planning, Manipulation) & Revenue KPI List each show separately esp. if different show times are expected to have different micros attending Can group certain days together only if you believe they will have similar demand patterns. Forecasted number of customers (your assumption) need to be realistic Yield = all seats (266) sold at the highest $ on your price list; therefore, offering deep price cuts is not desirabl If your demand forecast for a show is low, that means you are not confident about that show time, so you should review if that show time is even needed? Use your business mind. 266 Seats product version Ticket price $ Forecasted occ. by micro seats % Forecasted tt! revenue Forecasted RevPas / show $ Forecasted yield Forecasted yield % % $ Monday R-showtime X Micros A Micros B # # $ Total # Total % Total $ $ $ % Tuesday R-showtime X Micros A Micros B $ $ # # Total # Total % Total $ $ $ % Forecasted yield $ Forecasted yield % % 266 product version Ticket Forecasted Forecasted tt Forecasted Seats price occ. by micro revenue RevPas / show $ seats % $ $ Monday 3D - showtime X Micros A S # Micros B S # Total # Total % Total $ Tuesday 3D - showtime X Micros A S # Micros B $ # Total # Total % Total $ Note: you can change the look of the table to better fit your style, as long as all the required info are there $ % $ %
Step by Step Solution
There are 3 Steps involved in it

Get step-by-step solutions from verified subject matter experts