

Question: Mini proposal 1: RM strategy - Cinema 2. Proposal: 7- day PRO strategy for a regular week of a blockbuster movie D. Pricing . set

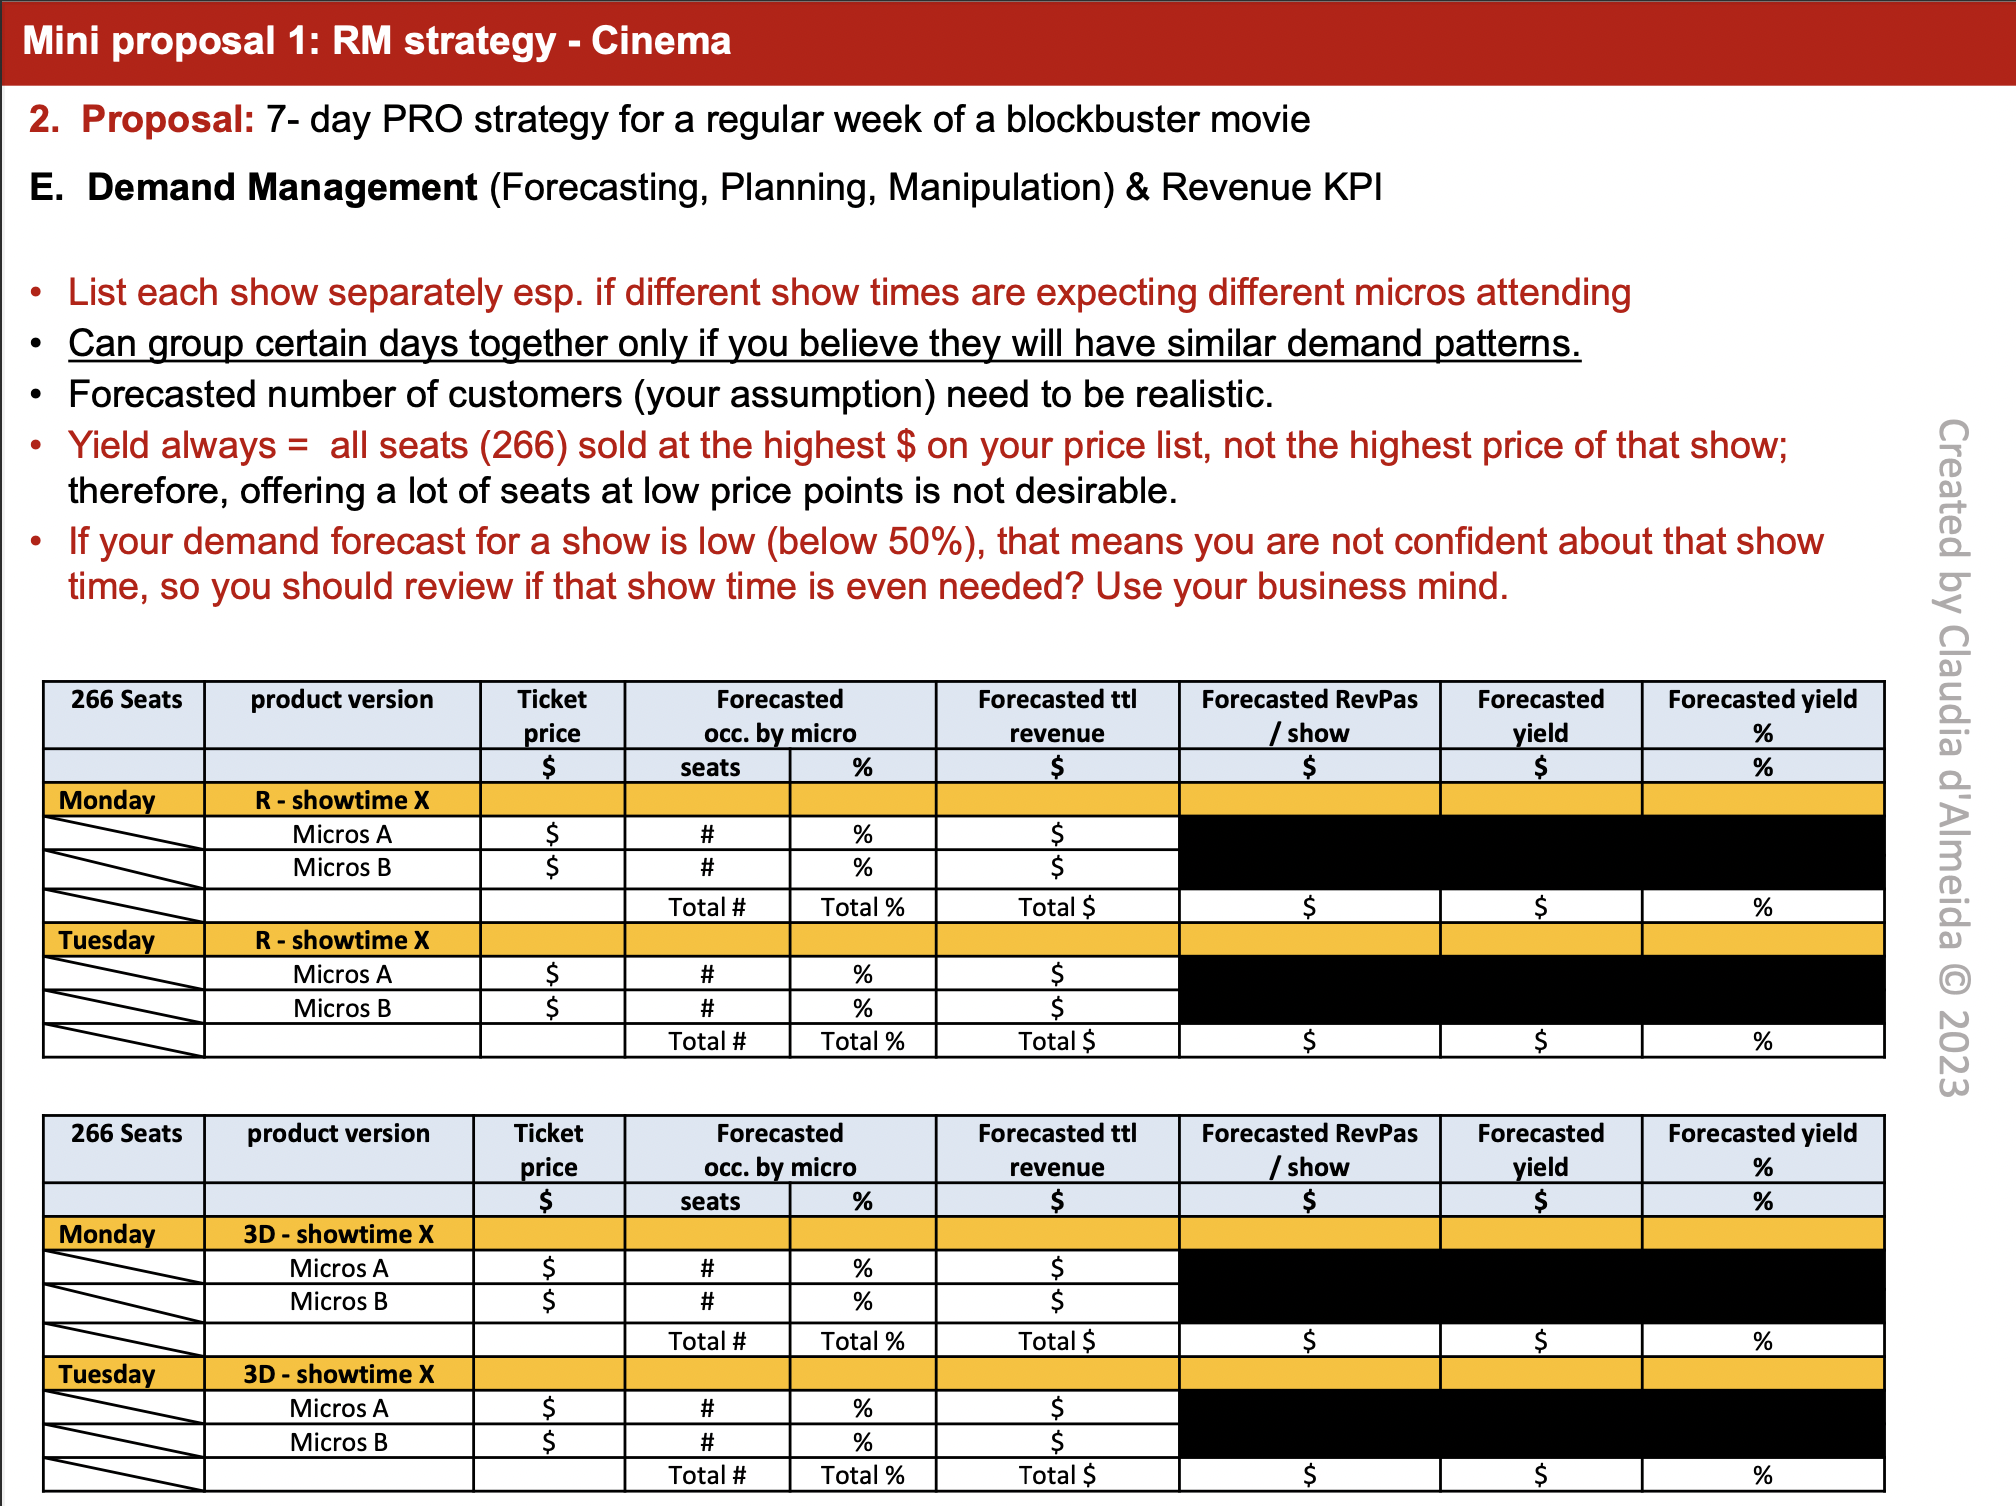
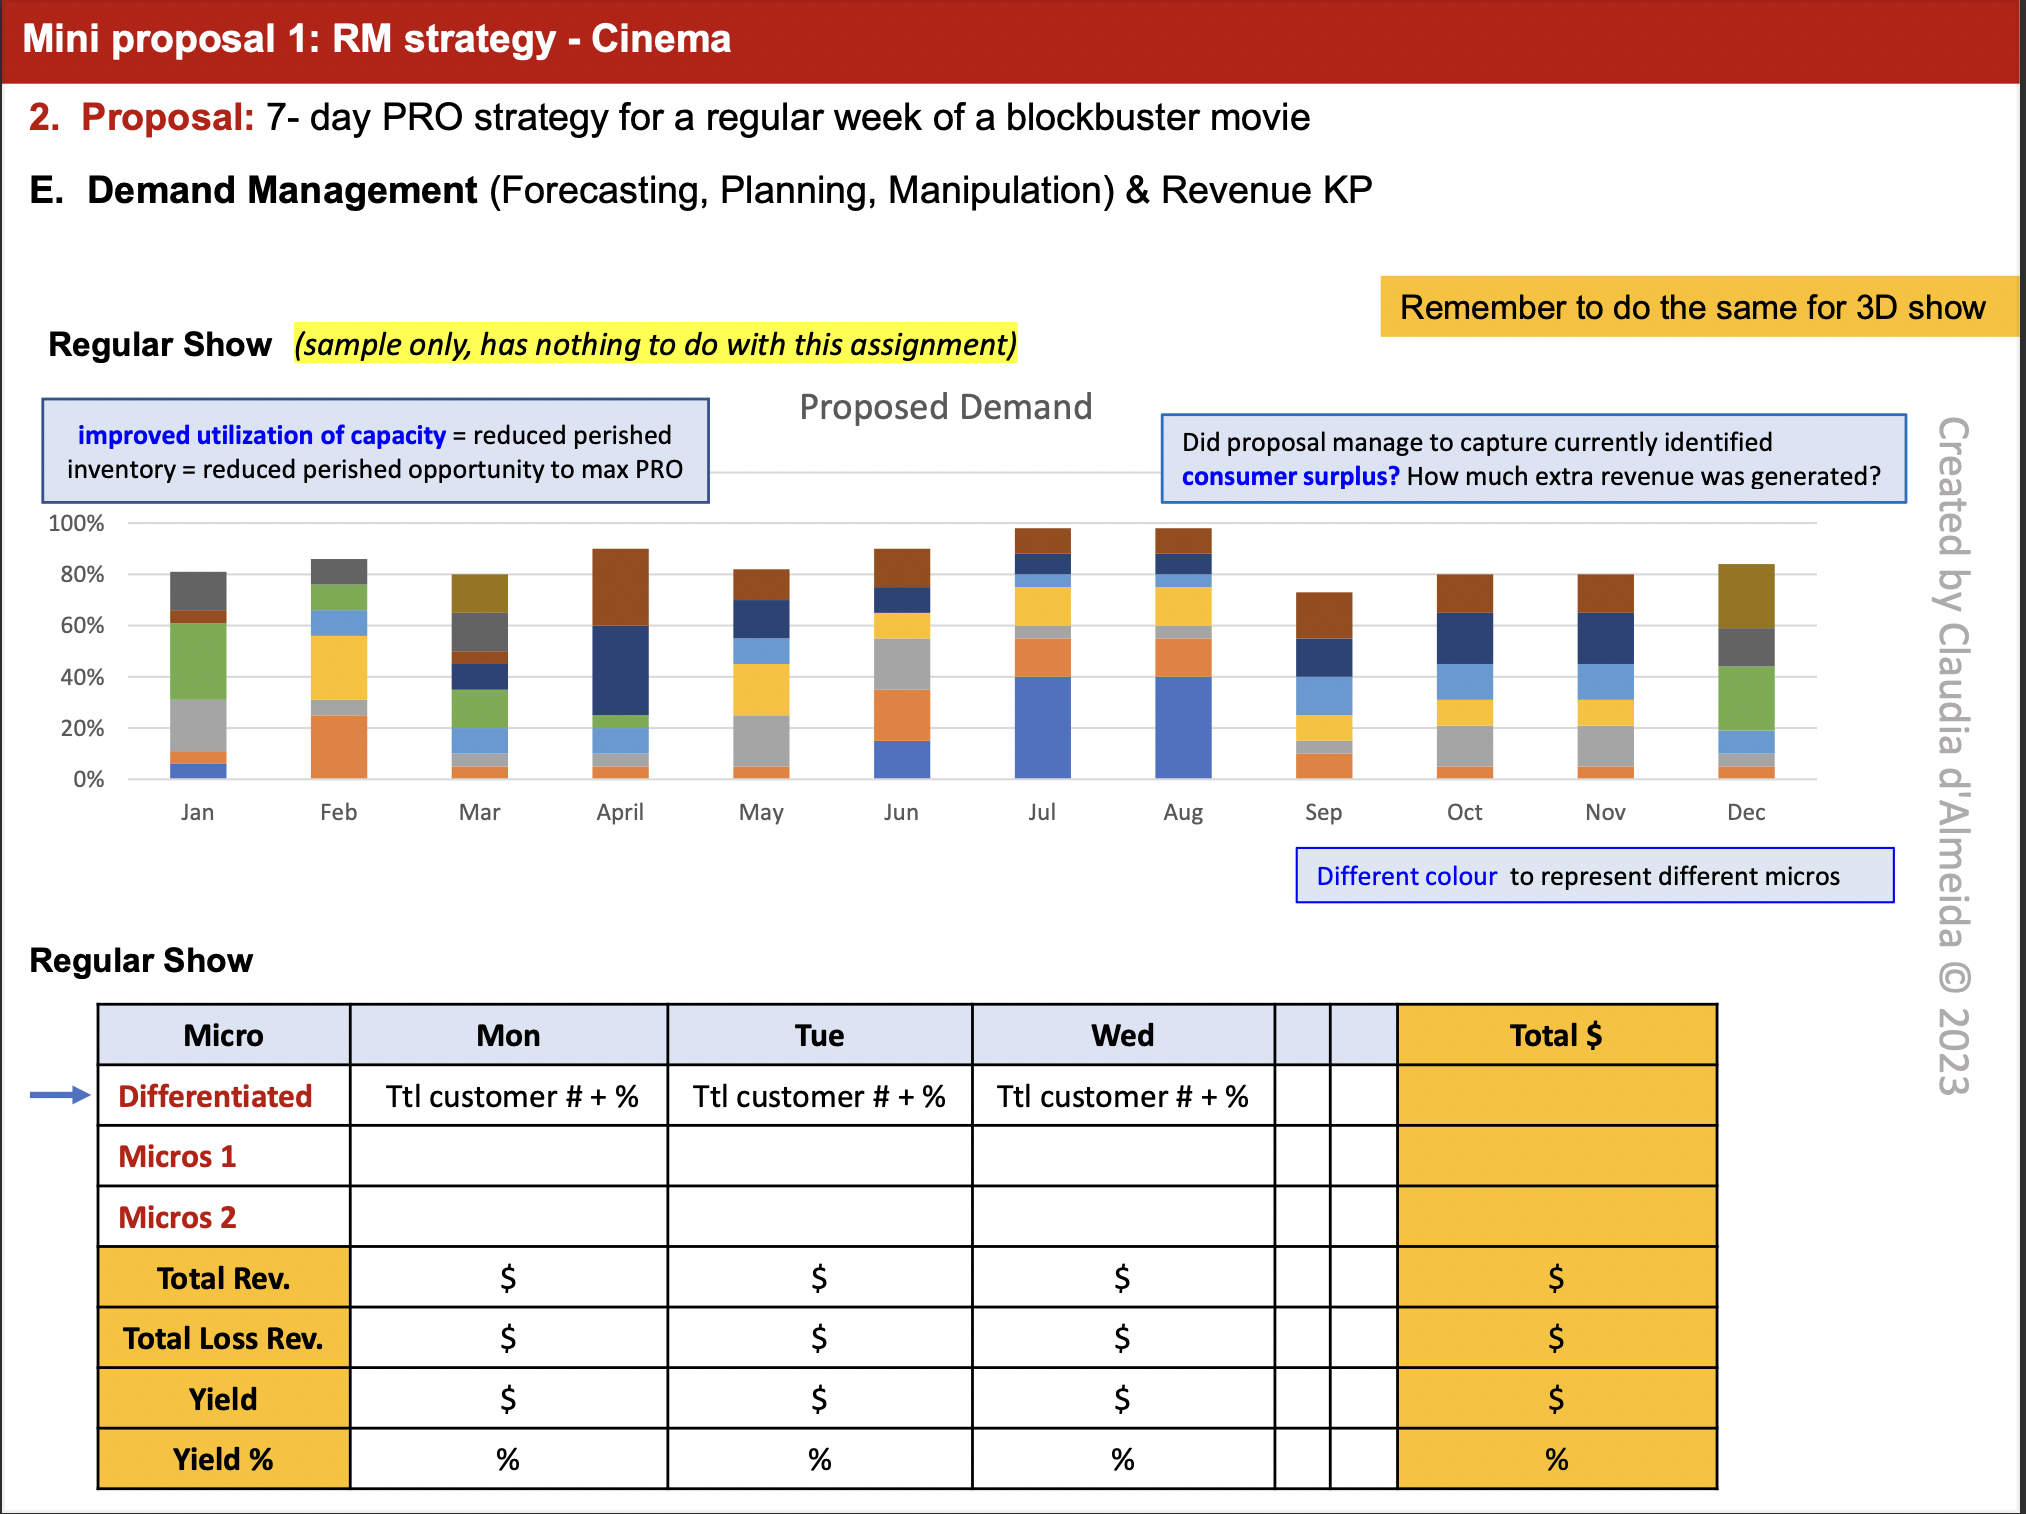
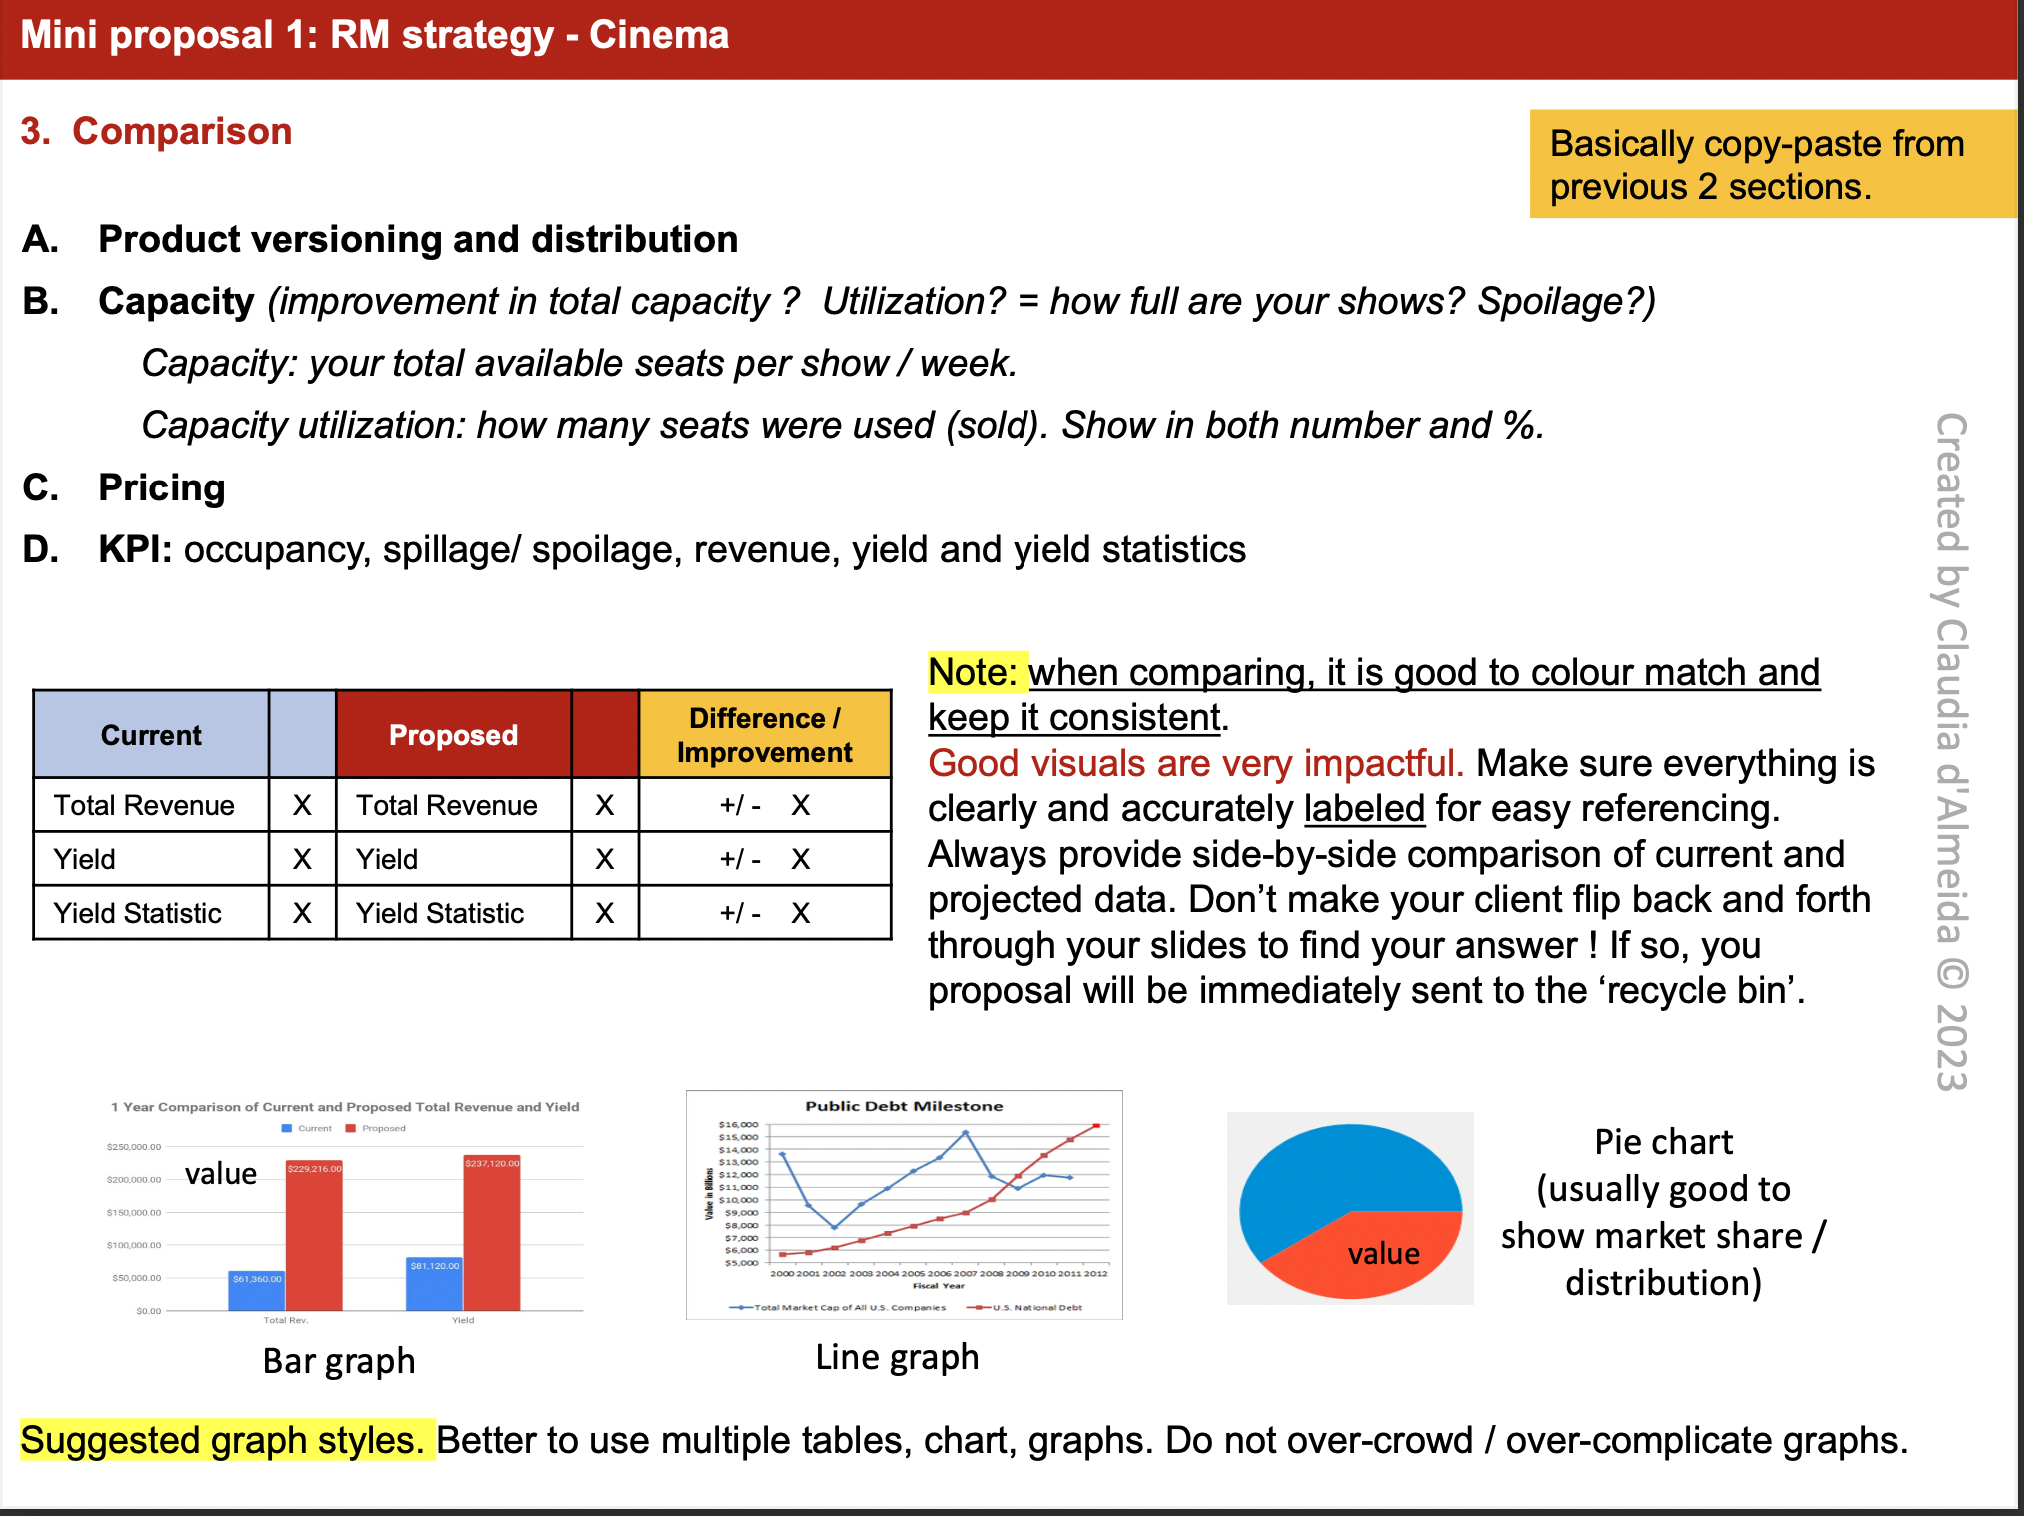
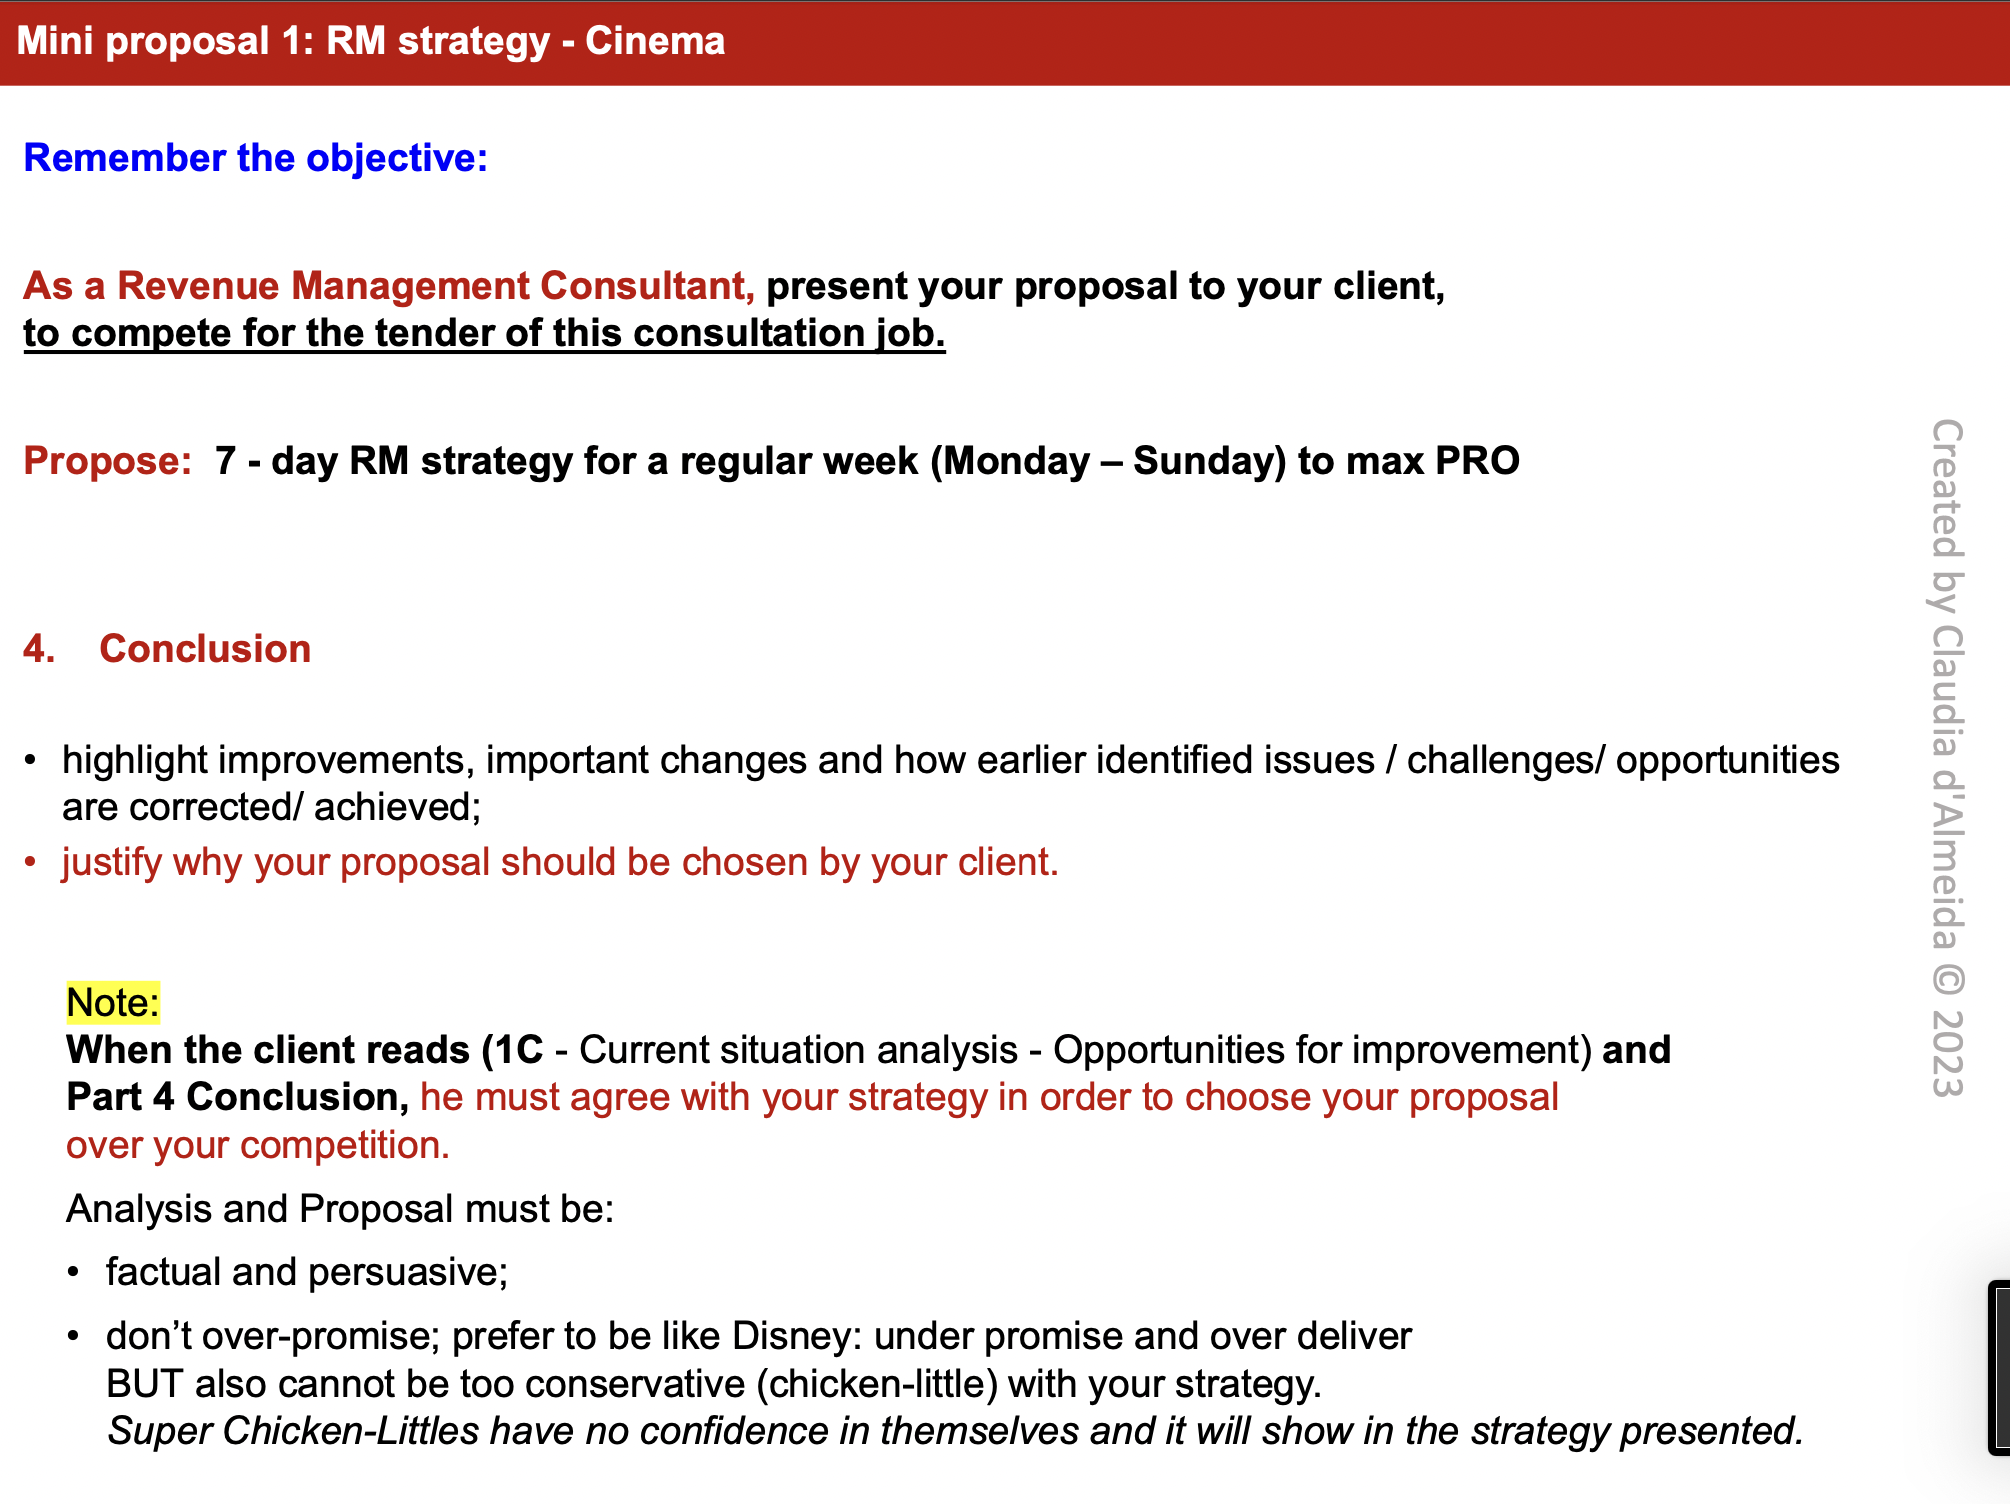
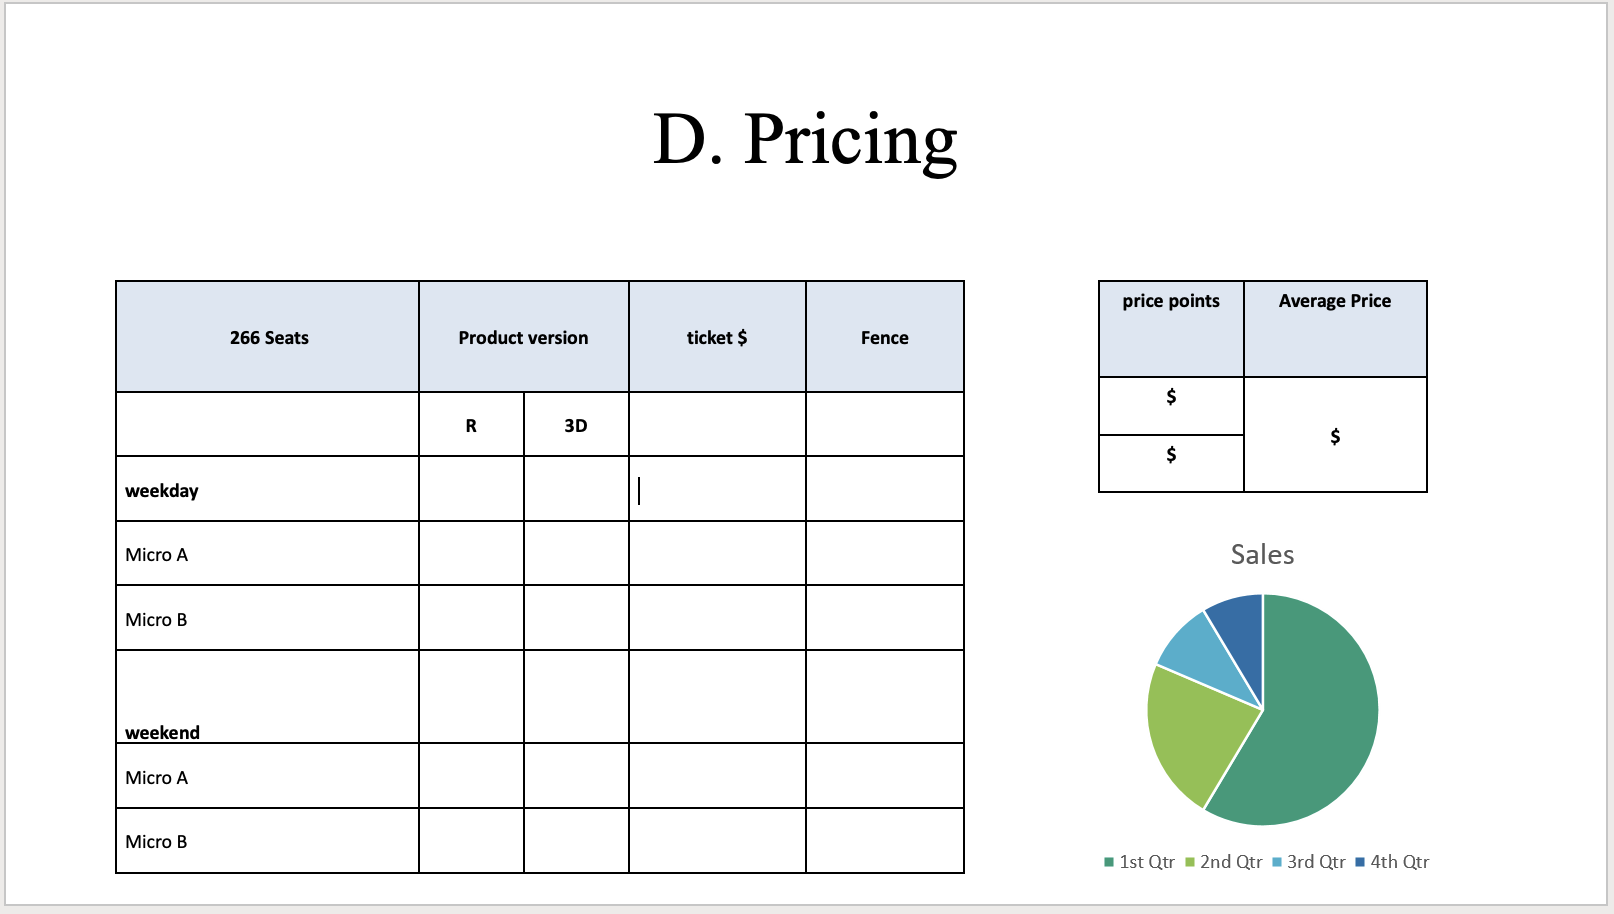


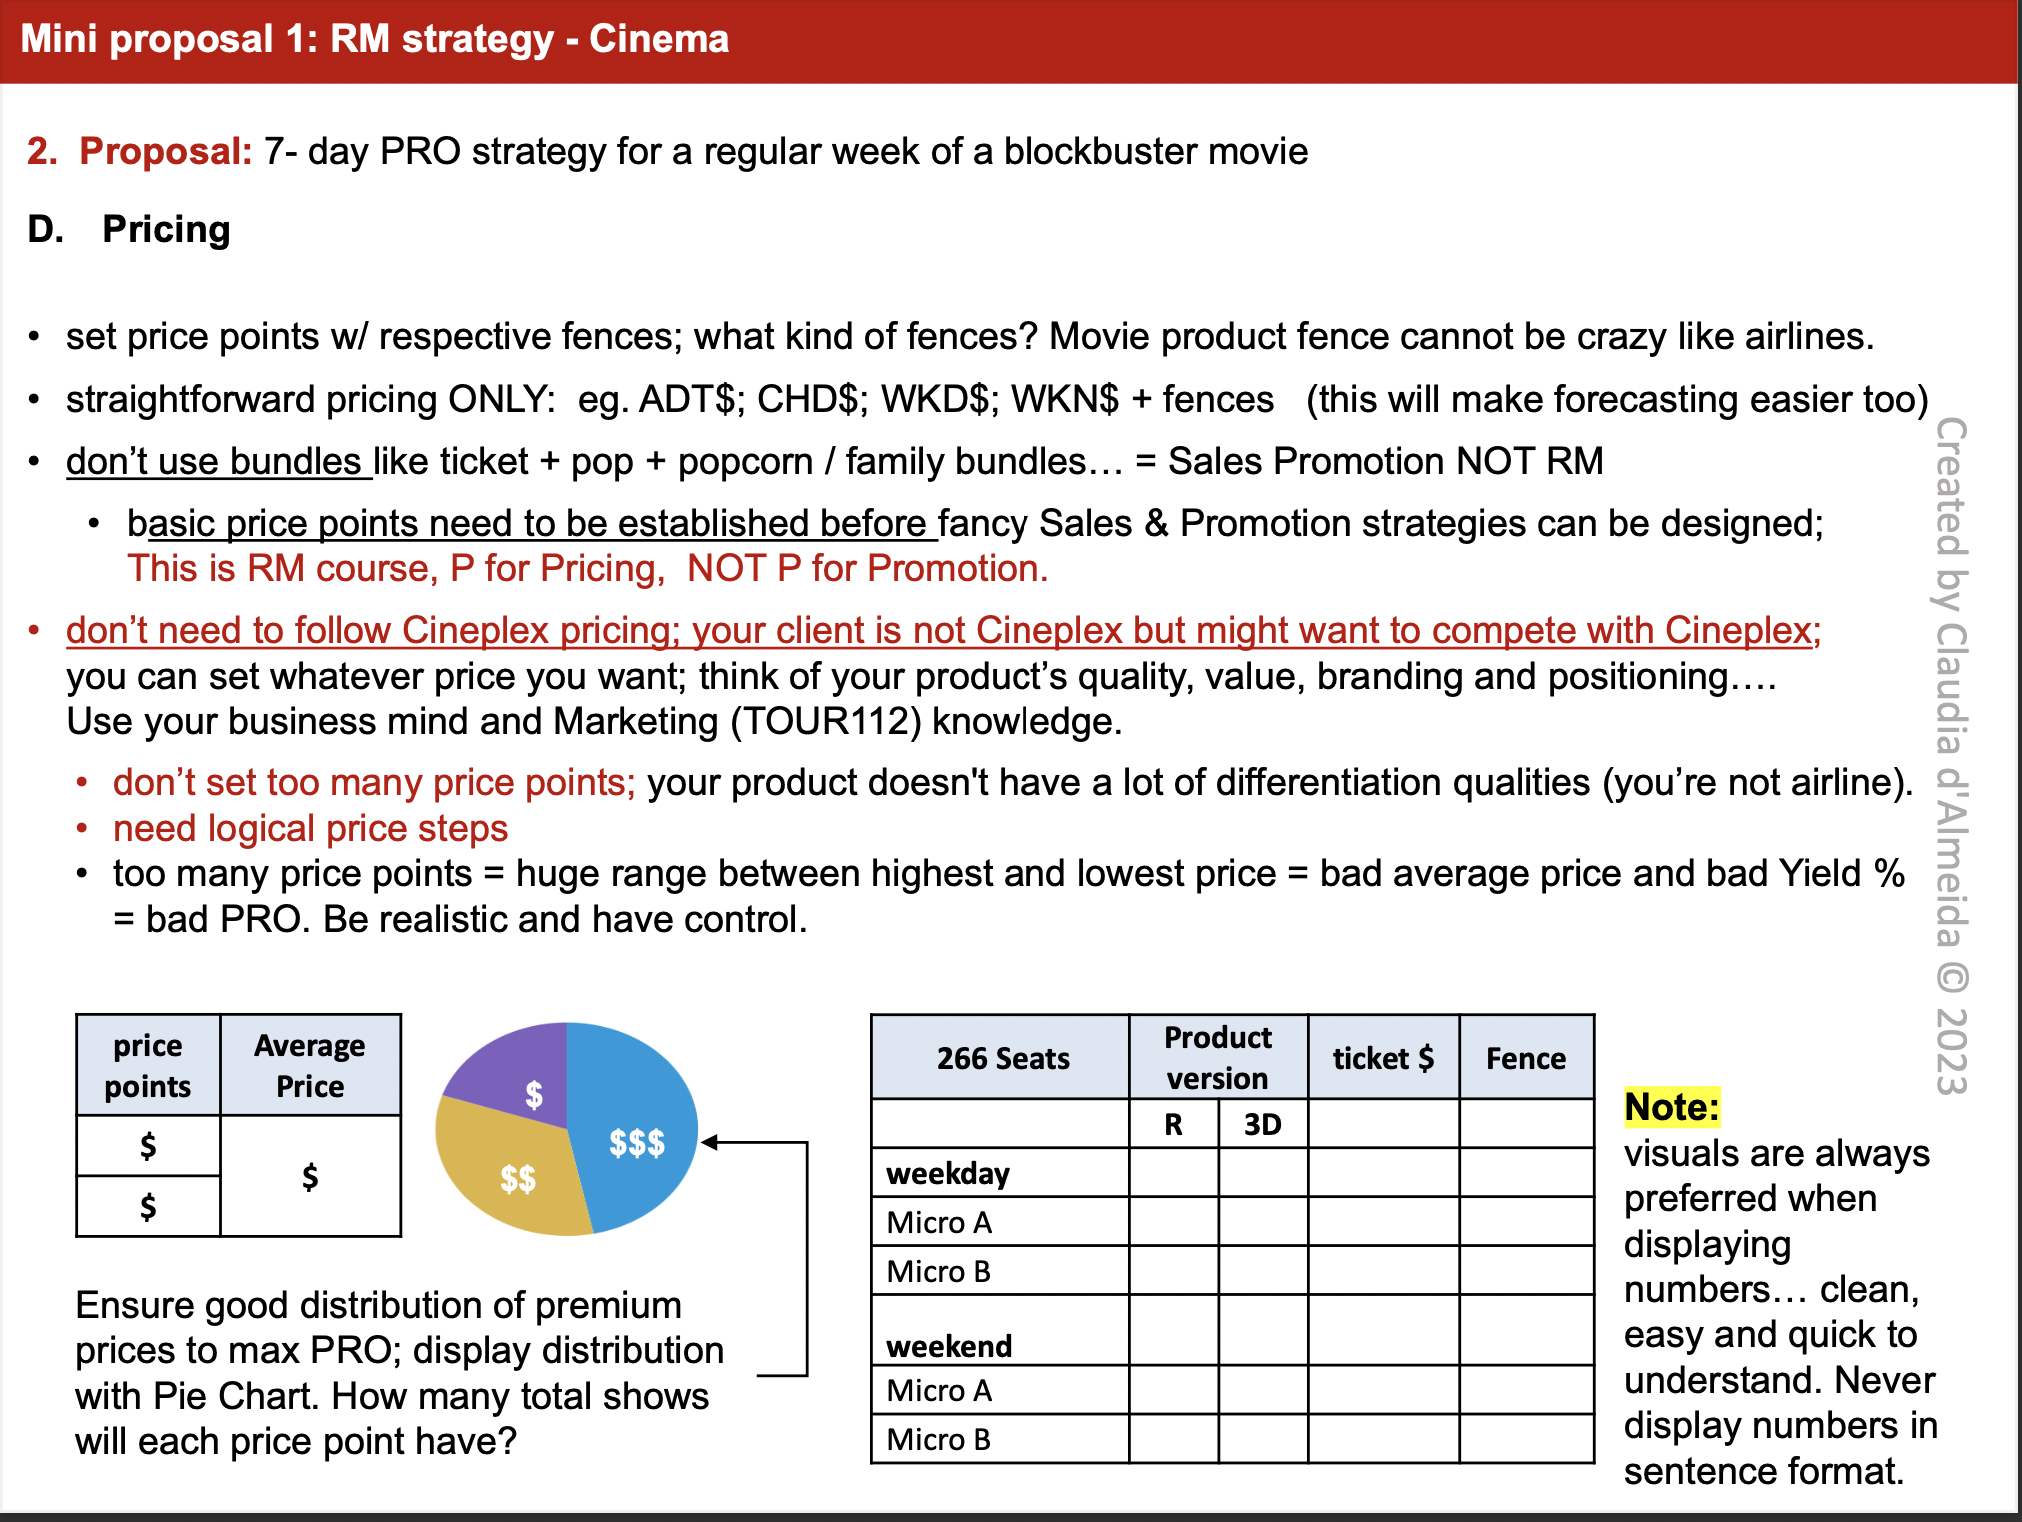


Mini proposal 1: RM strategy - Cinema 2. Proposal: 7- day PRO strategy for a regular week of a blockbuster movie D. Pricing . set price points w/ respective fences; what kind of fences? Movie product fence cannot be crazy like airlines. straightforward pricing ONLY: eg. ADT$; CHD$; WKD$; WKN$ + fences (this will make forecasting easier too) . don't use bundles like ticket + pop + popcorn / family bundles... = Sales Promotion NOT RM . basic price points need to be established before fancy Sales & Promotion strategies can be designed; This is RM course, P for Pricing, NOT P for Promotion. don't need to follow Cineplex pricing; your client is not Cineplex but might want to compete with Cineplex; you can set whatever price you want; think of your product's quality, value, branding and positioning.... Use your business mind and Marketing (TOUR112) knowledge. Created by Claudia d'Almeida 2023 . don't set too many price points; your product doesn't have a lot of differentiation qualities (you're not airline). . need logical price steps too many price points = huge range between highest and lowest price = bad average price and bad Yield % = bad PRO. Be realistic and have control. price Average Product 266 Seats ticket $ Fence points Price $ version Note: $$$ R 3D S $ $$ weekday visuals are always preferred when Micro A displaying Micro B Ensure good distribution of premium numbers... clean, prices to max PRO; display distribution weekend easy and quick to with Pie Chart. How many total shows Micro A understand. Never will each price point have? Micro B display numbers in sentence format.Mini proposal 1: RM strategy - Cinema 2. Proposal: 7- day PRO strategy for a regular week of a blockbuster movie E. Demand Management (Forecasting, Planning, Manipulation) & Revenue KPI . List each show separately esp. if different show times are expecting different micros attending Can group certain days together only if you believe they will have similar demand patterns. Forecasted number of customers (your assumption) need to be realistic. . Yield always = all seats (266) sold at the highest $ on your price list, not the highest price of that show; therefore, offering a lot of seats at low price points is not desirable. . If your demand forecast for a show is low (below 50%), that means you are not confident about that show time, so you should review if that show time is even needed? Use your business mind. 266 Seats product version Ticket Forecasted Forecasted tti Forecasted RevPas Forecasted Forecasted yield price occ. by micro revenue /show yield % S seats % $ $ % Created by Claudia d'Almeida @ 2023 Monday R - showtime X Micros A # % Micros B % Total # Total % Total $ $ S % Tuesday R - showtime X Micros A # % Micros B # % Total # Total % Total $ S % 266 Seats product version Ticket Forecasted Forecasted tti Forecasted RevPas Forecasted Forecasted yield price occ. by micro revenue / show yield % S seat % $ $ % Monday 3D - showtime X Micros A # % Micros B # Total # Total % Total S S % Tuesday 3D - showtime X Micros A # % Micros B # Total # Total % Total $ SMini proposal 1: RM strategy - Cinema 2. Proposal: 7- day PRO strategy for a regular week of a blockbuster movie E. Demand Management (Forecasting, Planning, Manipulation) & Revenue KP Remember to do the same for 3D show Regular Show (sample only, has nothing to do with this assignment) Proposed Demand improved utilization of capacity = reduced perished Did proposal manage to capture currently identified inventory = reduced perished opportunity to max PRO consumer surplus? How much extra revenue was generated? 100% 30% 60% 40% 20% Created by Claudia d'Almeida @ 2023 0% Jan Feb Mar April May Jun Jul Aug Sep Oct Nov Dec Different colour to represent different micros Regular Show Micro Mon Tue Wed Total $ Differentiated Ttl customer # + % Ttl customer # + % Ttl customer # + % Micros 1 Micros 2 Total Rev. Total Loss Rev. Yield un un Yield % % %Mini proposal 1: RM strategy - Cinema 3. Comparison Basically copy-paste from previous 2 sections. A. Product versioning and distribution B. Capacity (improvement in total capacity ? Utilization? = how full are your shows? Spoilage?) Capacity: your total available seats per show / week. Capacity utilization: how many seats were used (sold). Show in both number and %. C. Pricing D. KPI: occupancy, spillage/ spoilage, revenue, yield and yield statistics Note: when comparing, it is good to colour match and Current Proposed Difference / keep it consistent. Improvement Created by Claudia d'Almeida @ 2023 Good visuals are very impactful. Make sure everything is Total Revenue X Total Revenue X +/ - X clearly and accurately labeled for easy referencing. Yield X Yield X +/ - X Always provide side-by-side comparison of current and Yield Statistic X Yield Statistic X +/ - X projected data. Don't make your client flip back and forth through your slides to find your answer ! If so, you proposal will be immediately sent to the 'recycle bin'. 1 Year Comparison of Current and Proposed Total Revenue and Yield Public Debt Milestone $250,000.00 Pie chart $200,000.00 - value e in Billions (usually good to $150,000.00 $100,000.00 value show market share / $50,000.00 Fiscal Year 2030 2021 2012 distribution) $0.00 Bar graph Line graph Suggested graph styles. Better to use multiple tables, chart, graphs. Do not over-crowd / over-complicate graphs.Mini proposal 1: RM strategy - Cinema Remember the objective: As a Revenue Management Consultant, present your proposal to your client, to compete for the tender of this consultation iob. Propose: 7 - day RM strategy for a regular week (Monday - Sunday) to max PRO 4. Conclusion - highlight improvements, important changes and how earlier identied issues / challenges/ opportunities are corrected/ achieved; - justify why your proposal should be chosen by your client. Note: When the client reads (1C - Current situation analysis - Opportunities for improvement) and Part 4 Conclusion, he must agree with your strategy in order to choose your proposal over your competition. Analysis and Proposal must be: - factual and persuasive; - don't over-promise; prefer to be like Disney: under promise and over deliver BUT also cannot be too conservative (chicken-little) with your strategy. Super Chicken-Littles have no condence in themselves and it will show in the strategy presented. Mini proposal 1: RM strategy - Cinema Remember the objective: As a Revenue Management Consultant, present your proposal to your client, to compete for the tender of this consultation iob. Propose: 7 - day RM strategy for a regular week (Monday Sunday) to max PRO 4. Conclusion - highlight improvements, important changes and how earlier identified issues / challenges/ opportunities are corrected/ achieved; - justify why your proposal should be chosen by your client. Note: When the client reads (1C - Current situation analysis - Opportunities for improvement) and Part 4 Conclusion, he must agree with your strategy in order to choose your proposal over your competition. Analysis and Proposal must be: - factual and persuasive; - don't over-promise; prefer to be like Disney: under promise and over deliver BUT also cannot be too conservative (chicken-little) with your strategy. Super Chicken-Littles have no condence in themselves and it will show in the strategy presented. D. Pricing price points Average Price 266 Seats Product version ticket $ Fence R 3D weekday Micro A Sales Micro B weekend Micro A Micro B 1st Qtr # 2nd Qtr = 3rd Qtr # 4th QtrE. Demand Management & Projected revenue KPI Regular Show 266 Seats product version Ticket Forecasted Forecasted ttl Forecasted RevPas Forecasted Forecasted yield price occ. by micro revenue show yield % $ seats % S S S % Monday R - showtime X Micros A # % $ Micros B Total # Total % Total $ S S % Tuesday R - showtime X Micros A # % S Micros B # % Total # Total % Total $ $ $ % 3D Show 266 Seats product version Ticket Forecasted Forecasted ttl Forecasted RevPas Forecasted Forecasted yield price occ. by micro revenue / show yield % $ seats % $ $ $ % Monday 3D - showtime X Micros A # % S Micros B # % Total # otal % Total S S % Tuesday 3D - showtime X Micros A # $ Micros B # Total # Total % Total $ S S %E. Demand Management & Projected revenue KPI Proposed Demand 15 10 5 0 Jan. Feb Mar Apr May Jun Jul Aug Sep Oct Nov Dec Series 1 Series 2 Series 3 _ Series 4 _ Series 5 Series 6 Micro Mon Tue Wec Total $ Differentiated Ttl customer # + % Ttl customer # + % Ttl customer # + % Micros 1 Micros 2 Total Rev. ur ur Total Loss Rev. in Yield un Yield % %
Step by Step Solution
There are 3 Steps involved in it

Get step-by-step solutions from verified subject matter experts