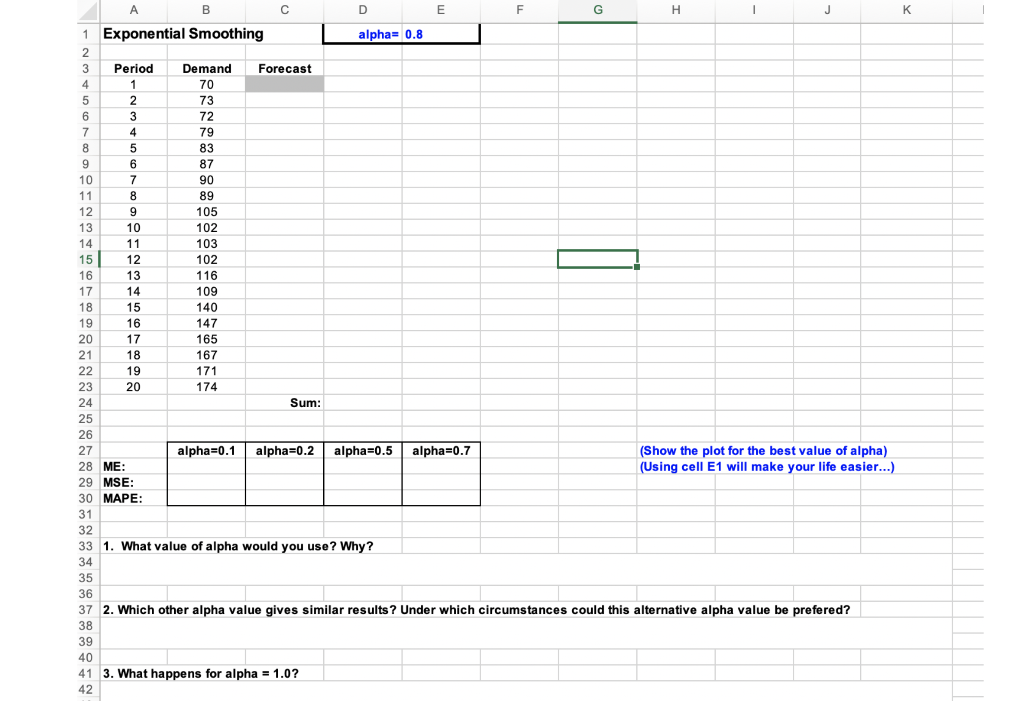
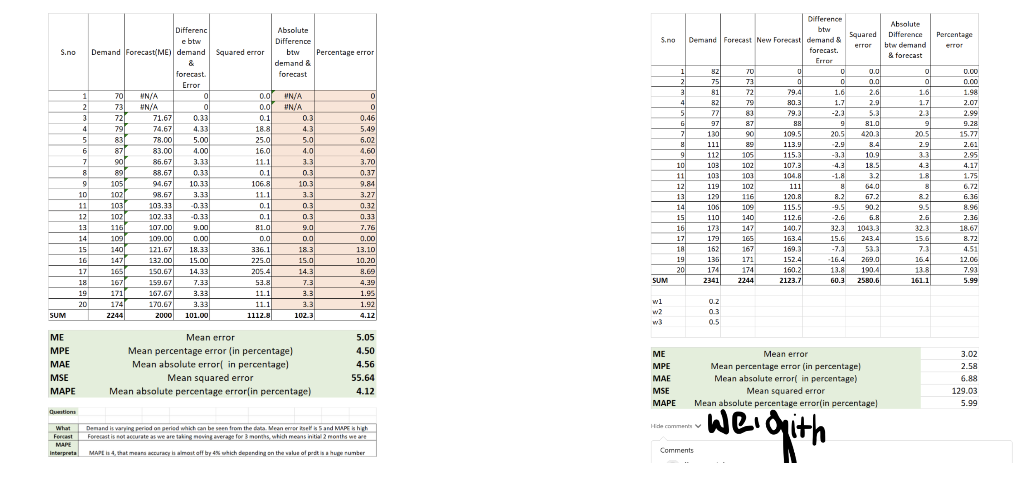
Question: please help me with solving exponential Smoothing. I have already solved the Moving average and weighted moving average B 1 Following this worksheet (using the

please help me with solving exponential Smoothing. I have already solved the Moving average and weighted moving averageplease help me with solving exponential

please help me with solving exponential

please help me with solving exponential

B 1 Following this worksheet (using the tabs at the bottom of this page), you will find several 2 worksheets. Each includes a series of demand data. On each sheet: 3 1. Use the labeled method to fit a forecast to this data. 4 2. If parameters are required (e.g. alpha, w_1 w_2...), you can use some trial and error. 5 Show at least 3 trials, and use the 'best' one for the plot. 3. Plot the actual demand vs. the forecast. The first one is done for you as an example (as 6 you input forecast values, the forecast plot will show up). 7 3. Calculate the various error measures at the bottom of the sheet. 8 4. Answer any questions that appear at the bottom of the sheet. 9 6. Submit the worksheet to the Dropbox on eCampus 10 11 12 13 14 15 16 17 18 19 20 21 22 23 24 25 26 27 28 29 30 31 READ FIRST MA N=3 WMA Exp-Smoothing + B D E F G H -- J K alpha= 0.8 1 Exponential Smoothing 2 3 Period Demand Forecast 4 1 70 5 2 73 6 3 72 7 4 79 8 5 83 9 6 87 10 7 90 . 11 8 89 40 12 9 105 13 10 102 14 11 103 od 15 12 102 16 13 116 2 17 14 109 18 15 140 19 16 147 20 17 165 21 18 167 22 19 171 20 174 Sum: 23 24 25 20 26 27 alpha=0.1 alpha=0.2 alpha=0.5 alpha=0.7 (Show the plot for the best value of alpha) 28 ME: (Using cell E1 will make your life easier...) 29 MSE: 30 MAPE: 31 32 33 1. What value of alpha would you use? Why? 34 35 36 37 2. Which other alpha value gives similar results ? Under which circumstances could this alternative alpha value be prefered? 38 39 40 41 3. What happens for alpha = 1.0? 42 Differenc e btw Demand Forecast ME) demand Squared error Percentage error S.no Absolute Difference btw Percentage error demand & forecast 701 73 721 79 forecast Error 0 0 0.33 4.33 0 0 0.46 5.49 5.02 4.60 3.70 0.37 1 2 3 3 4 5 6 7 8 9 10 11 12 13 14 15 16 17 18 19 20 UN/A / UN/A 71.67 74.67 78.00 83.00 85.67 88.67 94.67 98.67 103.33 102.33 107.00 109.00 121.67 132.00 150.67 159.67 167.67 170.67 2000 5.00 4.00 3.33 0.33 10.33 3.33 -0.33 -0.33 9.00 871 90 891 1051 102 103 1071 1161 1091 1401 147 165 167 171 174 2244 0.0 WN/A 0.01 UN/A 0.11 03 188 43 25.0 5.0 16.01 4.0 11.1 33 0.1 03 106.8 10.31 11.1 3.3 0.1 03 0.1 0.3 81.0 9.0 0.0 0.0 336.1 18.3 225.0 15.0 205.41 14.3 53.8 7.3 11.1 11.11 33 1112.8 102.3 Difference Absolute btw S.no Demand Forecast New Forecast demand & Squared Difference error btw demand forecast. & forecast Error 1 BZ 70 0 0 0.0 ol 2 751 73 ol 0 o a.al 0 31 811 72 29.4 1.6 2.6 161 4 82 79 80.31 1.7 2.91 17 51 77 89 79.31 -2.3 5.31 23 G 97 88 9 81.0 9 7 21 190 90 109.51 20.5 42031 205 2051 111 113.91 -2.9 29 9 112 105 115.31 -3.3 10.91 3:31 10 103 102 107.31 -4.3 18.5 4.3 11 103 103 104.8 -1.8 3.21 1.8 12 119 102 111 64.0 13 120 116 120.8 67.21 14 105 109 115.51 -9.5 90.2 9.51 15 110 140 112.6 -2.6 5.R 2.5 16 173 147 140.7 32,2 1043.31 32 31 17 179 165 163.4 15.6 243.4 15.6 18 162 167 169.3 -7.3 73 19 135 171 152.41 -16.4 269.0 16.4 20 174 174 160.2 13.8 190.4 1381 SUM 2341 2244 2123.71 60.3 2580.6 161.1 0.00 0.00 1.98 2.07 2.99 9.28 15.77 2.61 2.95 4.17 1.75 6.72 6.36 8.96 2.36 18.67 8.72 4.51 12.06 7.90 5.99 0.00 18.33 15.00 14.33 7.33 3.33 3.33 101.00 3.27 0.32 0.33 7.76 0.00 13.10 10.20 8.69 4.39 1.95 1.92 4.12 02 03 0.5 wl w2 w SUM 5.05 3.02 ME MPE MAE MSE MAPE Mean error Mean percentage error in percentage) Mean absolute error in percentage) Mean squared error Mean absolute percentage error(in percentage) 4.50 4.56 55.64 4.12 ME MPE MAE MSE MAPE Mean error Mean percentage error (in percentage! Mean absolute error in percentage) Mean squared error Mean absolute percentage error(in percentagel 2.58 6.88 129.03 5.99 Dutions weignith Hide come What Demand is varying period on period which can be seen from the data. Mean error sets Sand MAPS high Forcast Forecast is not accurate as we are taking moving average for 3 months, which means in til 2 months we are MAPE Interpreta MAPEI 4, that mean curacy is almost off by which depending on the value of pretina huge number Comments

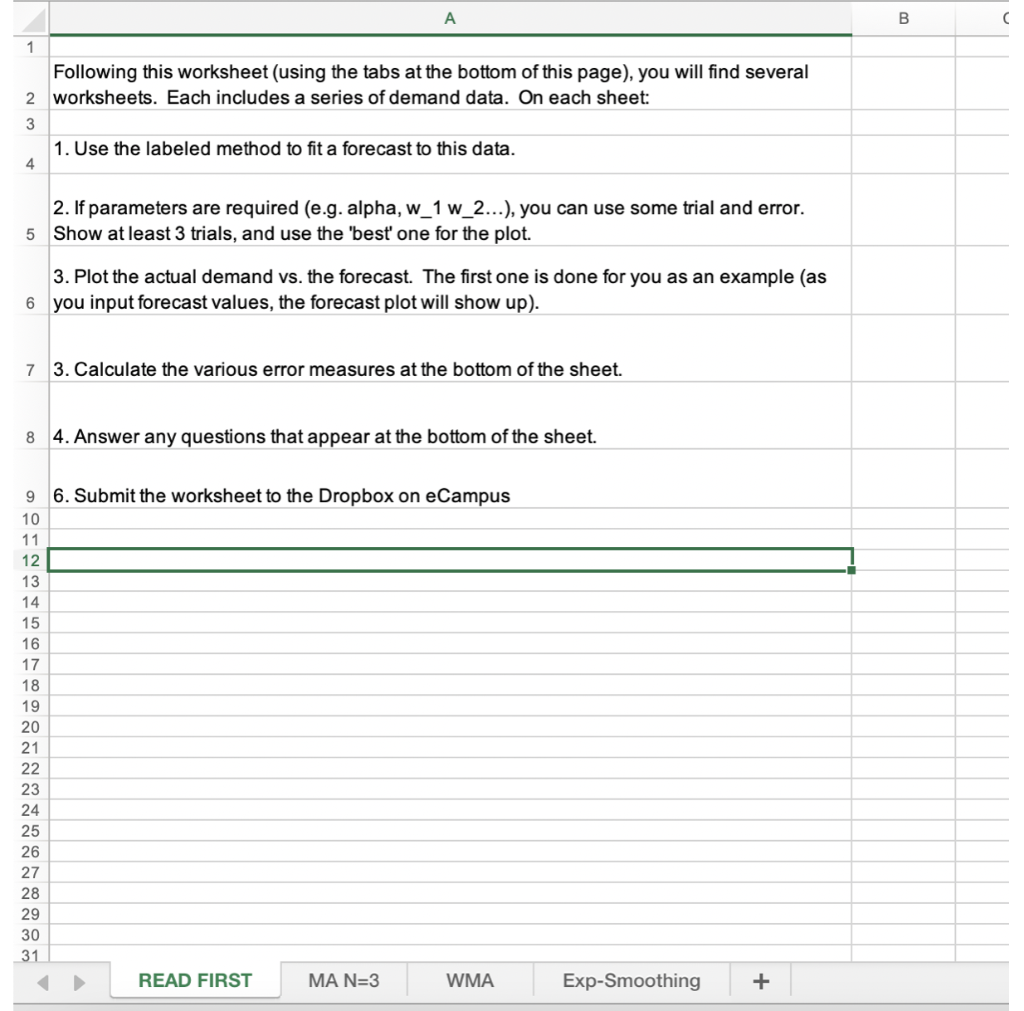
Step by Step Solution

There are 3 Steps involved in it

1 Expert Approved Answer
Step: 1 Unlock blur-text-image
Question Has Been Solved by an Expert!

Get step-by-step solutions from verified subject matter experts

Step: 2 Unlock
Step: 3 Unlock

Students Have Also Explored These Related General Management Questions!