

Question: Please help me with the analysis part. i have included the excel document and each part of it 1. There are some typographical errors in
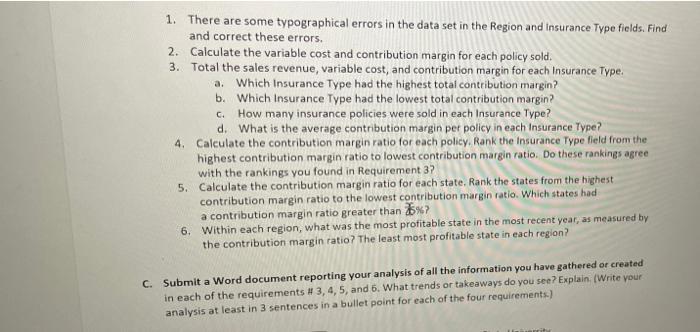
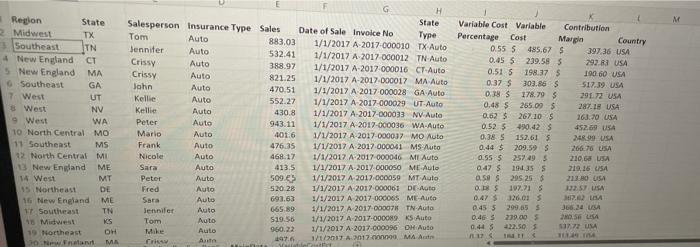
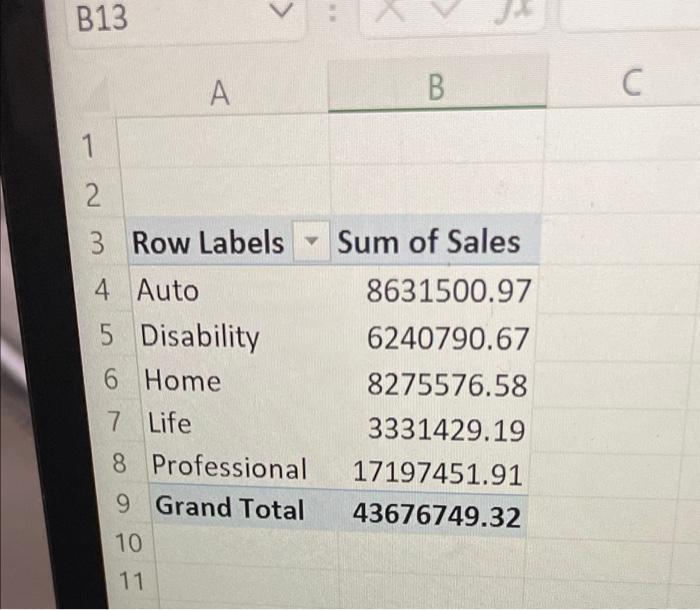
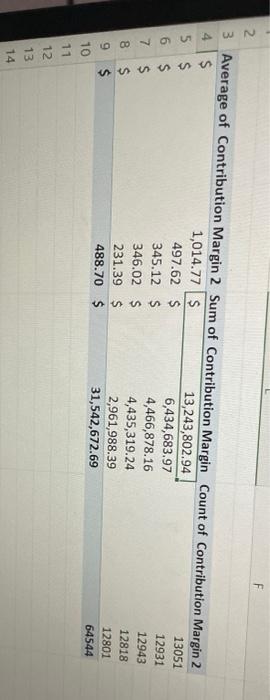
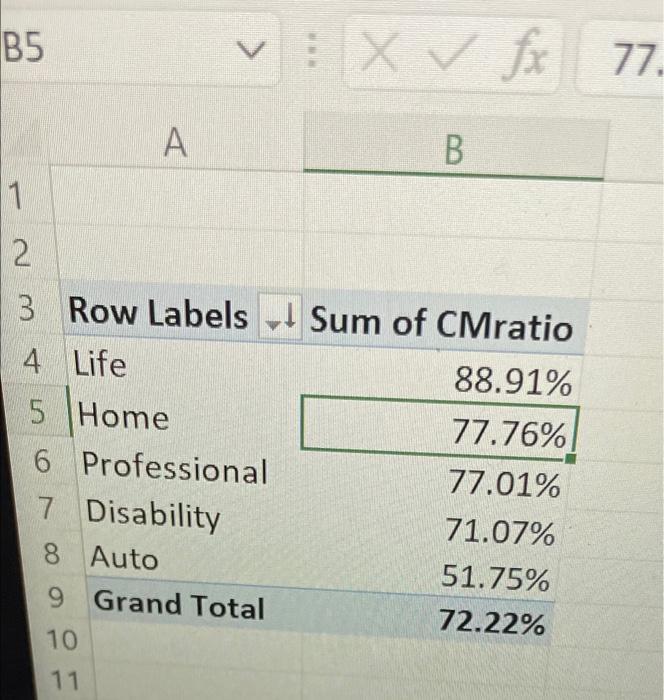
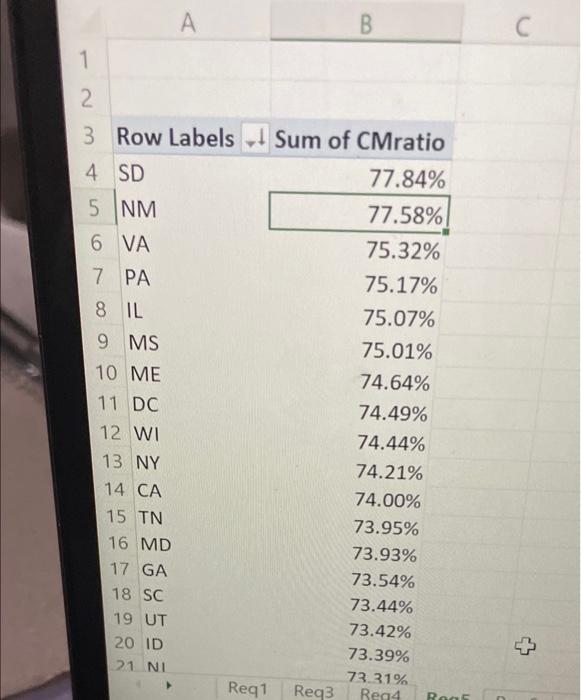
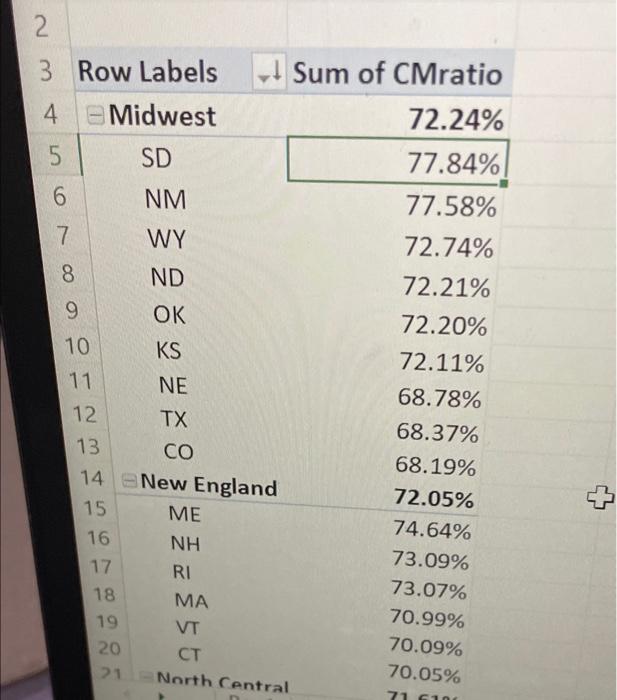
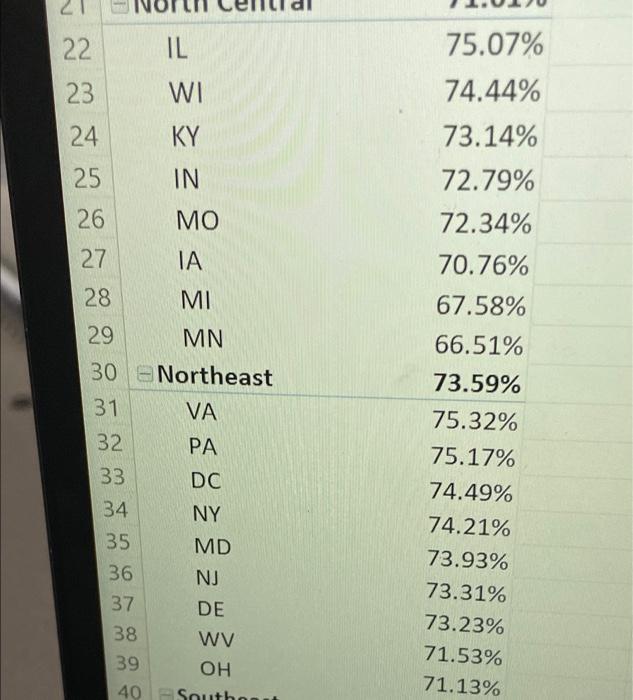
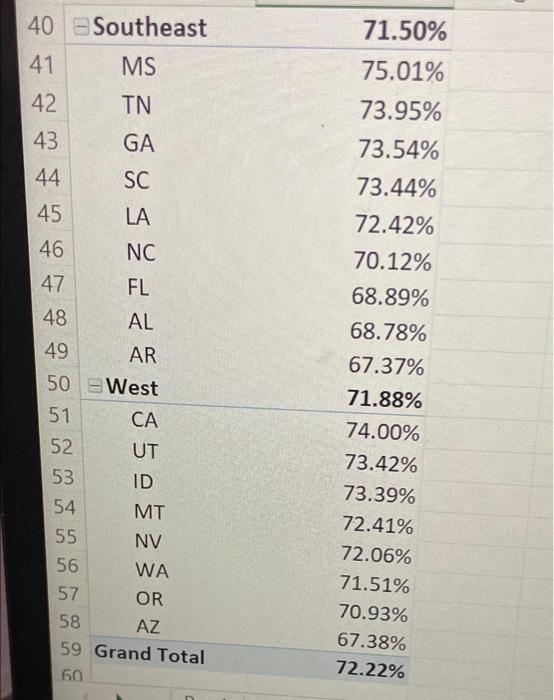

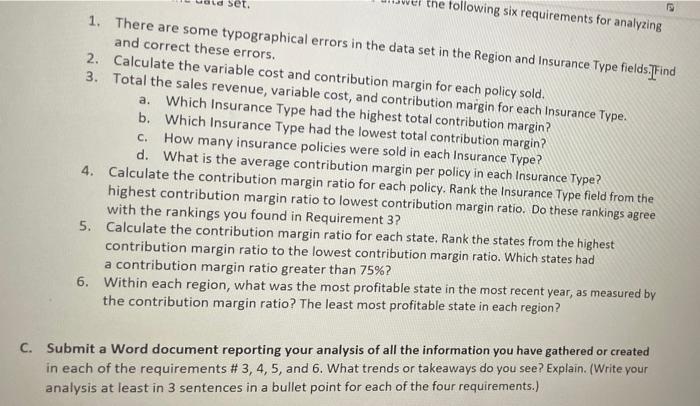
1. There are some typographical errors in the data set in the Region and Insurance Type fields. Find and correct these errors. 2. Calculate the variable cost and contribution margin for each policy sold. 3. Total the sales revenue, variable cost, and contribution margin for each Insurance Type: a. Which Insurance Type had the highest total contribution margin? b. Which Insurance Type had the lowest total contribution margin? C. How many insurance policies were sold in each Insurance Type? d. What is the average contribution margin per policy in each Insurance Type? 4. Calculate the contribution margin ratio for each policy. Rank the Insurance Type field from the highest contribution margin ratio to lowest contribution margin ratio. Do these rankings agree with the rankings you found in Requirement 3? 5. Calculate the contribution margin ratio for each state, Rank the states from the highest contribution margin ratio to the lowest contribution margin ratio. Which states had a contribution margin ratio greater than %? Within each region, what was the most profitable state in the most recent year, as measured by the contribution margin ratio? The least most profitable state in each region? C. Submit a Word document reporting your analysis of all the information you have gathered or created in each of the requirements #3, 4, 5, and 6. What trends or takeaways do you see? Explain (Write your analysis at least in 3 sentences in a bullet point for each of the four requirements.) M 430.8 Region State 2 Midwest TX Southeast TN 4 New England CT 5 New England MA Southeast GA IT West UT 8 West NV 9 West WA 10 North Central MO 11 Southeast MS 12 North Central MI U New England ME 14 West MT 15 Northeast DE 16 New England ME 17 Southeast TN 10 Midwest KS 19 Northeast OH wat MA H State Salesperson Insurance Type Sales Date of Sale Invoice No Tom Type Auto 883.03 1/1/2017 A-2017-000010 TX Auto Jennifer Auto 532.41 1/1/2017 A 2017-000012 TN-Auto Crissy Auto 388.97 1/1/2017 A-2017-000016 CV Auto Crissy Auto 821.25 1/1/2017 A-2017-000017 MA Auto John Auto 470.51 1/1/2017 A 2017.000028 GA Auto Kellie Auto 552.27 1/1/2017 A-2017-000029 UT Auto Kellie Auto 1/1/2017 A 2017-000033 NV Auto Peter Auto 943.11 1/1/2017 A-2017-000036 WA-Auto Mario Auto 4016 1/1/2017 A 2017-000037 MO Auto Frank Auto 476.35 1/1/2017 A 2017.000041 MS-Auto Nicole Auto 468.17 1/1/2017 A-2017-000046 MI Auto Sara 413.5 1/1/2017 A 2017 000050 ME Auto Peter Auto 509 1/1/2017 A-2017-000059 MT Auto Fred Auto 520 28 1/1/2017 - 2017-000063 DE Auto Sara Auto 693.63 1/1/2017 A 2017-000065 ME Auto Jennifer Auto 665 89 1/1/2017 A 2017.00007 TN Auto Tom 1/1/2017 A 2017-000089 KS Auto Auto $19.55 Mike Auto 960.22 1/1/2017 A 2017.00006 DH Auto 1976 1/1/2017 2017 MAA Cri Atte Variable Cost Variable Contribution Percentage Cost Margin Country 0.55 5 485.67 S 397.36 USA 0.45 5 239.585 292.31 USA 0.51 5 198.375 190.60 USA 0:37 S 303.865 517.39 USA 0.83 178.795 29 L 72 USA 0.48 5 255.00 $ 287.18 USA 0.62 3 267.10 $ 263.70 USA 0.525 490.425 452.69 USA 0.385 152.615 24.90 USA 0.44 $ 209.595 266.76 USA 0:55 5 257.495 210,63 USA 0.47 $ 1935 21 16 USA OS 295 25$ 213.0 USA 085 197.21 12:57 USA 0.473 126.015 12.02 0.455 299.655 366.34 USA 0.46 $ 279.00 5 2. USA 0.44 5 22.505 USA IT Auto B13 A B 1 2 3 Row Labels 4 Auto 5 Disability 6 Home 7 Life 8 Professional 9 Grand Total 10 Sum of Sales 8631500.97 6240790.67 8275576.58 3331429.19 17197451.91 43676749.32 11 F 2. 3 Average of Contribution Margin 2 Sum of Contribution Margin Count of Contribution Margin 2 4 $ 1,014.77 $ 13,243,802.94 5 $ 13051 497.62 $ 6,434,683.97 6 $ 12931 345.12 $ 4,466,878.16 7 $ 12943 346.02 $ 4,435,319.24 12818 $ 231.39 $ 2,961,988.39 12801 g $ 488.70 $ 31,542,672.69 64544 10 11 12 13 8 00 14 B5 VOX fx 77. A B 1 2 3 Row Labels - Sum of CMratio 4 Life 88.91% 5 Home 77.76% 6 Professional 77.01% 7 Disability 71.07% 8 Auto 51.75% 9 Grand Total 72.22% 10 11 A B 1 2 3 Row Labels 1 Sum of CMratio 4 SD 77.84% 5 NM 77.58% 6 VA 75.32% 7 PA 75.17% 8 IL 75.07% 9 MS 75.01% 10 ME 74.64% 11 DC 74.49% 12 WI 74.44% 13 NY 74.21% 14 CA 74.00% 15 TN 73.95% 16 MD 73.93% 17 GA 73.54% 18 SC 73.44% 19 UT 73.42% 20 ID 73.39% 21 NI 73.31% Req1 Req3 Reg4 Re 2 3 Row Labels Sum of CMratio 4 e Midwest 72.24% 5 SD 77.84% 6 NM 77.58% 7 WY 72.74% 8 ND 72.21% 9 OK 72.20% 10 KS 72.11% 11 NE 68.78% 12 TX 68.37% 13 68.19% 14 New England 72.05% 15 ME 74.64% 16 NH 73.09% 17 RI 73.07% 18 MA 70.99% 19 VT 70.09% 20 CT 70.05% 21 North Central 71 IL 22 23 75.07% 74.44% WI KY 24 73.14% 25 IN 72.79% 26 MO 72.34% 27 IA 70.76% 3 28 MI 29 MN 30 Northeast 31 VA 32 PA 33 DC 34 NY 35 MD 36 NJ 37 DE 38 WV 39 OH 40 South 67.58% 66.51% 73.59% 75.32% 75.17% 74.49% 74.21% 73.93% 73.31% 73.23% 71.53% 71.13% 40 Southeast 41 MS 42 43 GA 44 45 46 LA 47 ESSE = 5850E 48 49 71.50% 75.01% 73.95% 73.54% 73.44% 72.42% 70.12% 68.89% 68.78% 67.37% 71.88% 74.00% 73.42% 73.39% 72.41% 72.06% 71.51% 70.93% 67.38% 72.22% 50 E West 51 52 53 54 55 56 WA 57 OR 58 AZ 59 Grand Total 60 KAT Insurance Corporation: I Introductory Managerial Accounting Data Analytics Case Overview The demand for college graduates with data analytics skills has exploded, while the tools and techniques are continuing to evolve and change at a rapid pace. This case illustrates how data analytics can be performed, using a variety of tools including Excel. As you analyze this case, you will be learning how to drill-down into a company's sales and cost data to gain a deeper understanding of the company's sales and costs and how this information can be used for decision-making. Background This KAT Insurance Corporation data set is based on real-life data from a national insurance company. The data set contains more than 65,000 insurance sales records from 2017. All data and names have been anonymized to preserve privacy. Requirements A. You must use Office 365 (Excel) to complete this project. B. Submit your Excel file after completing all steps described in the tutorial The tutorial provides step-by-step instructions to answer the following six requirements for analyzing sales records in the data set. Set. the following six requirements for analyzing C. 1. There are some typographical errors in the data set in the Region and Insurance Type fields. Find and correct these errors. 2. Calculate the variable cost and contribution margin for each policy sold. 3. Total the sales revenue, variable cost, and contribution margin for each Insurance Type. a. Which Insurance Type had the highest total contribution margin? b. Which Insurance Type had the lowest total contribution margin? How many insurance policies were sold in each Insurance Type? d. What is the average contribution margin per policy in each Insurance Type? 4. Calculate the contribution margin ratio for each policy. Rank the Insurance Type field from the highest contribution margin ratio to lowest contribution margin ratio. Do these rankings agree with the rankings you found in Requirement 3? 5. Calculate the contribution margin ratio for each state. Rank the states from the highest contribution margin ratio to the lowest contribution margin ratio. Which states had a contribution margin ratio greater than 75%? 6. Within each region, what was the most profitable state in the most recent year, as measured by the contribution margin ratio? The least most profitable state in each region? C. Submit a Word document reporting your analysis of all the information you have gathered or created in each of the requirements #3, 4, 5, and 6. What trends or takeaways do you see? Explain. (Write your analysis at least in 3 sentences in a bullet point for each of the four requirements.) 1. There are some typographical errors in the data set in the Region and Insurance Type fields. Find and correct these errors. 2. Calculate the variable cost and contribution margin for each policy sold. 3. Total the sales revenue, variable cost, and contribution margin for each Insurance Type: a. Which Insurance Type had the highest total contribution margin? b. Which Insurance Type had the lowest total contribution margin? C. How many insurance policies were sold in each Insurance Type? d. What is the average contribution margin per policy in each Insurance Type? 4. Calculate the contribution margin ratio for each policy. Rank the Insurance Type field from the highest contribution margin ratio to lowest contribution margin ratio. Do these rankings agree with the rankings you found in Requirement 3? 5. Calculate the contribution margin ratio for each state, Rank the states from the highest contribution margin ratio to the lowest contribution margin ratio. Which states had a contribution margin ratio greater than %? Within each region, what was the most profitable state in the most recent year, as measured by the contribution margin ratio? The least most profitable state in each region? C. Submit a Word document reporting your analysis of all the information you have gathered or created in each of the requirements #3, 4, 5, and 6. What trends or takeaways do you see? Explain (Write your analysis at least in 3 sentences in a bullet point for each of the four requirements.) M 430.8 Region State 2 Midwest TX Southeast TN 4 New England CT 5 New England MA Southeast GA IT West UT 8 West NV 9 West WA 10 North Central MO 11 Southeast MS 12 North Central MI U New England ME 14 West MT 15 Northeast DE 16 New England ME 17 Southeast TN 10 Midwest KS 19 Northeast OH wat MA H State Salesperson Insurance Type Sales Date of Sale Invoice No Tom Type Auto 883.03 1/1/2017 A-2017-000010 TX Auto Jennifer Auto 532.41 1/1/2017 A 2017-000012 TN-Auto Crissy Auto 388.97 1/1/2017 A-2017-000016 CV Auto Crissy Auto 821.25 1/1/2017 A-2017-000017 MA Auto John Auto 470.51 1/1/2017 A 2017.000028 GA Auto Kellie Auto 552.27 1/1/2017 A-2017-000029 UT Auto Kellie Auto 1/1/2017 A 2017-000033 NV Auto Peter Auto 943.11 1/1/2017 A-2017-000036 WA-Auto Mario Auto 4016 1/1/2017 A 2017-000037 MO Auto Frank Auto 476.35 1/1/2017 A 2017.000041 MS-Auto Nicole Auto 468.17 1/1/2017 A-2017-000046 MI Auto Sara 413.5 1/1/2017 A 2017 000050 ME Auto Peter Auto 509 1/1/2017 A-2017-000059 MT Auto Fred Auto 520 28 1/1/2017 - 2017-000063 DE Auto Sara Auto 693.63 1/1/2017 A 2017-000065 ME Auto Jennifer Auto 665 89 1/1/2017 A 2017.00007 TN Auto Tom 1/1/2017 A 2017-000089 KS Auto Auto $19.55 Mike Auto 960.22 1/1/2017 A 2017.00006 DH Auto 1976 1/1/2017 2017 MAA Cri Atte Variable Cost Variable Contribution Percentage Cost Margin Country 0.55 5 485.67 S 397.36 USA 0.45 5 239.585 292.31 USA 0.51 5 198.375 190.60 USA 0:37 S 303.865 517.39 USA 0.83 178.795 29 L 72 USA 0.48 5 255.00 $ 287.18 USA 0.62 3 267.10 $ 263.70 USA 0.525 490.425 452.69 USA 0.385 152.615 24.90 USA 0.44 $ 209.595 266.76 USA 0:55 5 257.495 210,63 USA 0.47 $ 1935 21 16 USA OS 295 25$ 213.0 USA 085 197.21 12:57 USA 0.473 126.015 12.02 0.455 299.655 366.34 USA 0.46 $ 279.00 5 2. USA 0.44 5 22.505 USA IT Auto B13 A B 1 2 3 Row Labels 4 Auto 5 Disability 6 Home 7 Life 8 Professional 9 Grand Total 10 Sum of Sales 8631500.97 6240790.67 8275576.58 3331429.19 17197451.91 43676749.32 11 F 2. 3 Average of Contribution Margin 2 Sum of Contribution Margin Count of Contribution Margin 2 4 $ 1,014.77 $ 13,243,802.94 5 $ 13051 497.62 $ 6,434,683.97 6 $ 12931 345.12 $ 4,466,878.16 7 $ 12943 346.02 $ 4,435,319.24 12818 $ 231.39 $ 2,961,988.39 12801 g $ 488.70 $ 31,542,672.69 64544 10 11 12 13 8 00 14 B5 VOX fx 77. A B 1 2 3 Row Labels - Sum of CMratio 4 Life 88.91% 5 Home 77.76% 6 Professional 77.01% 7 Disability 71.07% 8 Auto 51.75% 9 Grand Total 72.22% 10 11 A B 1 2 3 Row Labels 1 Sum of CMratio 4 SD 77.84% 5 NM 77.58% 6 VA 75.32% 7 PA 75.17% 8 IL 75.07% 9 MS 75.01% 10 ME 74.64% 11 DC 74.49% 12 WI 74.44% 13 NY 74.21% 14 CA 74.00% 15 TN 73.95% 16 MD 73.93% 17 GA 73.54% 18 SC 73.44% 19 UT 73.42% 20 ID 73.39% 21 NI 73.31% Req1 Req3 Reg4 Re 2 3 Row Labels Sum of CMratio 4 e Midwest 72.24% 5 SD 77.84% 6 NM 77.58% 7 WY 72.74% 8 ND 72.21% 9 OK 72.20% 10 KS 72.11% 11 NE 68.78% 12 TX 68.37% 13 68.19% 14 New England 72.05% 15 ME 74.64% 16 NH 73.09% 17 RI 73.07% 18 MA 70.99% 19 VT 70.09% 20 CT 70.05% 21 North Central 71 IL 22 23 75.07% 74.44% WI KY 24 73.14% 25 IN 72.79% 26 MO 72.34% 27 IA 70.76% 3 28 MI 29 MN 30 Northeast 31 VA 32 PA 33 DC 34 NY 35 MD 36 NJ 37 DE 38 WV 39 OH 40 South 67.58% 66.51% 73.59% 75.32% 75.17% 74.49% 74.21% 73.93% 73.31% 73.23% 71.53% 71.13% 40 Southeast 41 MS 42 43 GA 44 45 46 LA 47 ESSE = 5850E 48 49 71.50% 75.01% 73.95% 73.54% 73.44% 72.42% 70.12% 68.89% 68.78% 67.37% 71.88% 74.00% 73.42% 73.39% 72.41% 72.06% 71.51% 70.93% 67.38% 72.22% 50 E West 51 52 53 54 55 56 WA 57 OR 58 AZ 59 Grand Total 60 KAT Insurance Corporation: I Introductory Managerial Accounting Data Analytics Case Overview The demand for college graduates with data analytics skills has exploded, while the tools and techniques are continuing to evolve and change at a rapid pace. This case illustrates how data analytics can be performed, using a variety of tools including Excel. As you analyze this case, you will be learning how to drill-down into a company's sales and cost data to gain a deeper understanding of the company's sales and costs and how this information can be used for decision-making. Background This KAT Insurance Corporation data set is based on real-life data from a national insurance company. The data set contains more than 65,000 insurance sales records from 2017. All data and names have been anonymized to preserve privacy. Requirements A. You must use Office 365 (Excel) to complete this project. B. Submit your Excel file after completing all steps described in the tutorial The tutorial provides step-by-step instructions to answer the following six requirements for analyzing sales records in the data set. Set. the following six requirements for analyzing C. 1. There are some typographical errors in the data set in the Region and Insurance Type fields. Find and correct these errors. 2. Calculate the variable cost and contribution margin for each policy sold. 3. Total the sales revenue, variable cost, and contribution margin for each Insurance Type. a. Which Insurance Type had the highest total contribution margin? b. Which Insurance Type had the lowest total contribution margin? How many insurance policies were sold in each Insurance Type? d. What is the average contribution margin per policy in each Insurance Type? 4. Calculate the contribution margin ratio for each policy. Rank the Insurance Type field from the highest contribution margin ratio to lowest contribution margin ratio. Do these rankings agree with the rankings you found in Requirement 3? 5. Calculate the contribution margin ratio for each state. Rank the states from the highest contribution margin ratio to the lowest contribution margin ratio. Which states had a contribution margin ratio greater than 75%? 6. Within each region, what was the most profitable state in the most recent year, as measured by the contribution margin ratio? The least most profitable state in each region? C. Submit a Word document reporting your analysis of all the information you have gathered or created in each of the requirements #3, 4, 5, and 6. What trends or takeaways do you see? Explain. (Write your analysis at least in 3 sentences in a bullet point for each of the four requirements.)
Step by Step Solution
There are 3 Steps involved in it

Get step-by-step solutions from verified subject matter experts