

Question: The table below shows the gold medal Olympic times (in seconds) for the 200-meter run. Data are shown for four of the first five
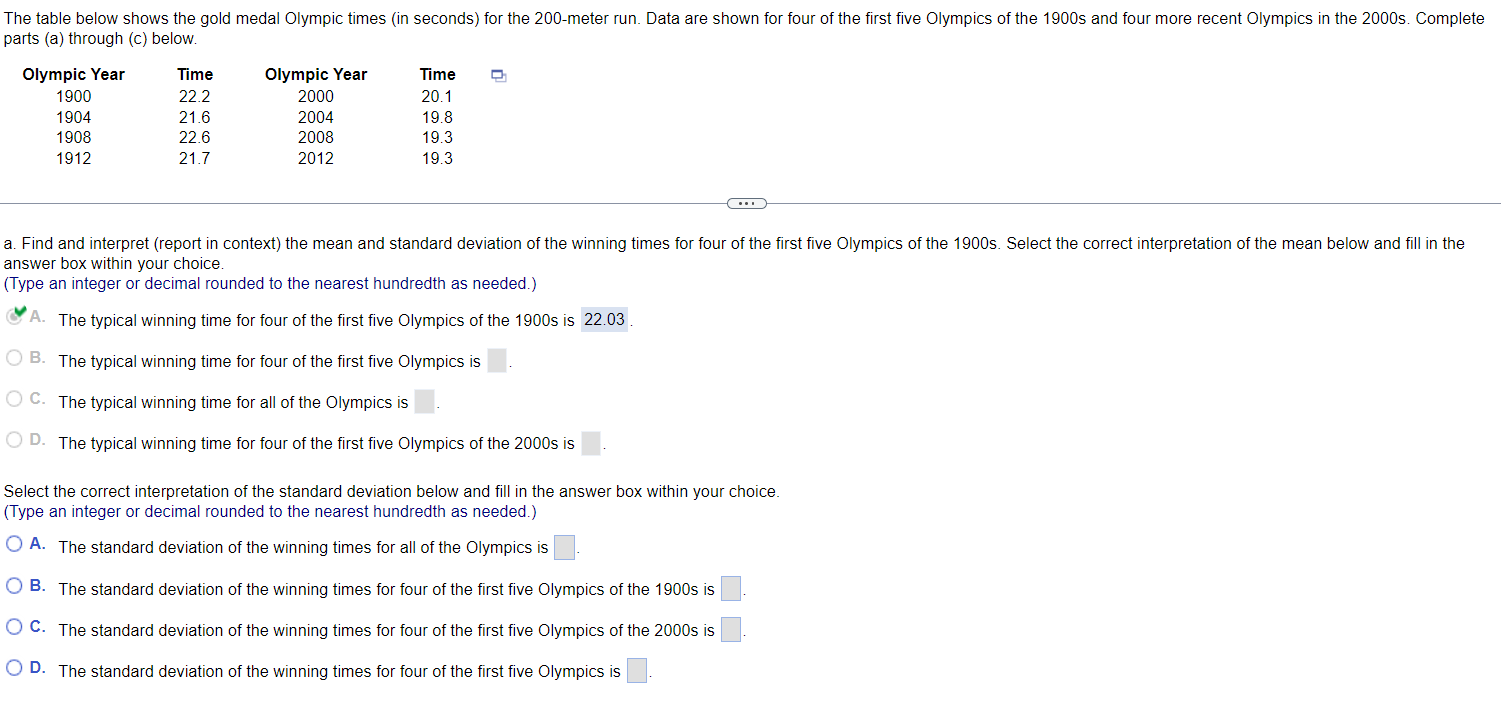
The table below shows the gold medal Olympic times (in seconds) for the 200-meter run. Data are shown for four of the first five Olympics of the 1900s and four more recent Olympics in the 2000s. Complete parts (a) through (c) below. Olympic Year Time Olympic Year Time 1900 22.2 2000 20.1 1904 21.6 2004 19.8 1908 1912 22.6 2008 19.3 21.7 2012 19.3 a. Find and interpret (report in context) the mean and standard deviation of the winning times for four of the first five Olympics of the 1900s. Select the correct interpretation of the mean below and fill in the answer box within your choice. (Type an integer or decimal rounded to the nearest hundredth as needed.) A. The typical winning time for four of the first five Olympics of the 1900s is 22.03. B. The typical winning time for four of the first five Olympics is C. The typical winning time for all of the Olympics is D. The typical winning time for four of the first five Olympics of the 2000s is Select the correct interpretation of the standard deviation below and fill in the answer box within your choice. (Type an integer or decimal rounded to the nearest hundredth as needed.) A. The standard deviation of the winning times for all of the Olympics is B. The standard deviation of the winning times for four of the first five Olympics of the 1900s is C. The standard deviation of the winning times for four of the first five Olympics of the 2000s is D. The standard deviation of the winning times for four of the first five Olympics is
Step by Step Solution
There are 3 Steps involved in it
To find the standard deviation of the winning times for four of the first five Olympics of the 1900s ... View full answer

Get step-by-step solutions from verified subject matter experts