

The table show the gold medal Olympic times (in seconds) for the 200-meter run. Data are shown
Question:
The table show the gold medal Olympic times (in seconds) for the 200-meter run. Data are shown for the first five Olympics of the 1900s and five more recent Olympics in the 2000s. (Source: World Almanac and Book of Facts 2017)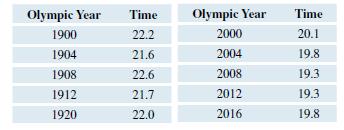
a. Find and interpret (report in context) the mean and standard deviation of the winning times for the first five Olympics of the 1900s. Round to the nearest hundredth of a second.
b. Find the mean and standard deviation of the winning times for the more recent Olympics.
c. Compare the winning times of the early 1900s and the 2000s Olympics. Are recent winners faster or slower than those of the early 1900s? Which group has less variation in its winning times?
Step by Step Answer:
a The mean of the winning times for the first five Olympics of the 1900s is mean 222 216 226 217 220 ...View the full answer


Introductory Statistics Exploring The World Through Data
ISBN: 9780135163146
3rd Edition
Authors: Robert Gould, Rebecca Wong, Colleen N. Ryan
