Question: please help me with the right option 17 A process that is assumed to be in control with limits of 90 + 2 had sample

please help me with the right option 17 please help me with the right option 17 A process
please help me with the right option 17 A process
A process that is assumed to be in control with limits of 90 + 2 had sample averages for the x-bar chart of the following: 87.1, 87, 87.2, 89, 90, 88.5, 89.5, and 88. Which of the following statement below are correct? Select one: O a. None is correct O b. Process mean is in-control O c Process mean is out-of-control O d. Not enough information to determine FACTORS FOR R CHARTS Number of Observations in Subgroup, Factor for X Chart, Lower Control Limit, Upper Control Limit, DA Az D3 2 3- 4 5 3.27 2.57 2.28 2.11 DOD 9 10 11 12 13 14 15 16 17 18 19 20 1.88 1.02 0.73 0.58 0.48 0.42 0.37 0.34 0.31 0.29 0.27 0.25 0.24 0.22 0.21 0 0 0 0 0 0.08 0.14 0.18 0.22 0.26 0.28 0.31 0.33 0.35 0.36 0.38 0.39 0.40 0.41 2.00 1.92 1.86 1.82 1.78 1.74 1.72 1.69 1.67 1.65 1.64 0.20 1.62 0.19 0.19 0.18 1.61 1.60 1.59

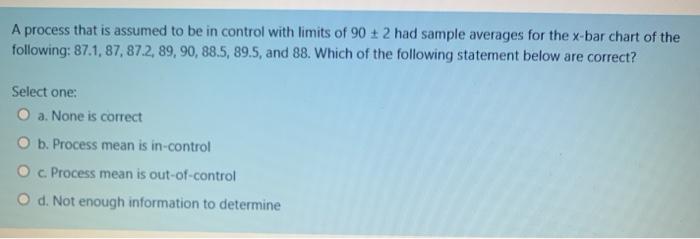
Step by Step Solution

There are 3 Steps involved in it

1 Expert Approved Answer
Step: 1 Unlock blur-text-image
Question Has Been Solved by an Expert!

Get step-by-step solutions from verified subject matter experts

Step: 2 Unlock
Step: 3 Unlock

Students Have Also Explored These Related General Management Questions!