

Question: Please help me with the yellow boxes that are clear? those are the ones I only need please and with work shown. Thank you, Financial
Please help me with the yellow boxes that are clear? those are the ones I only need please and with work shown.
Thank you,
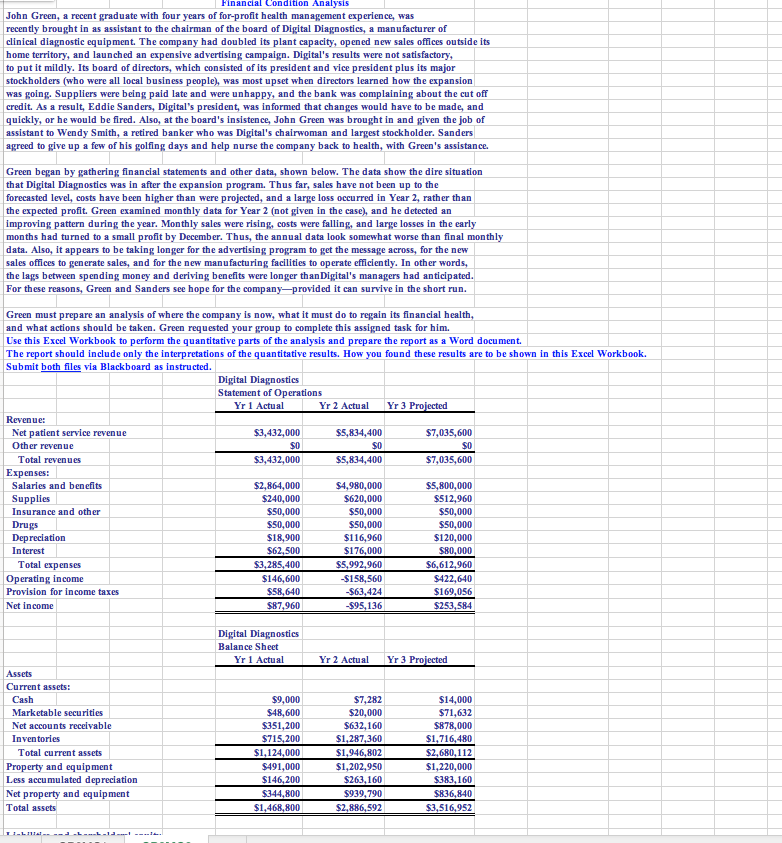
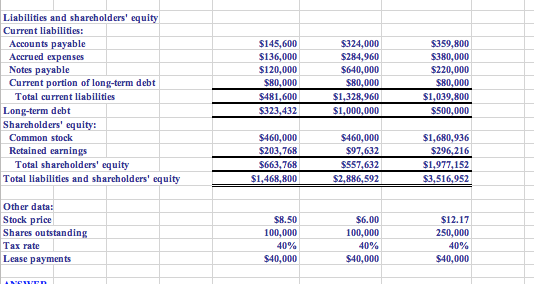
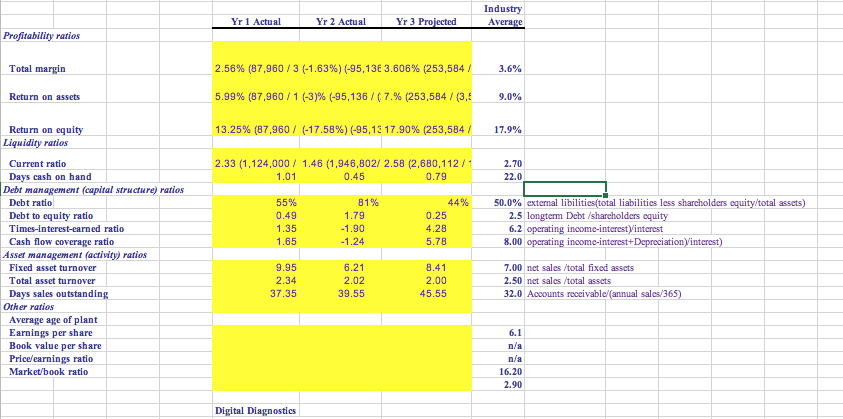
Financial Condition Analysis John Green, a recent graduate with four years of for-profit health management experience, was recently brought in as assistant to the chairman of the board of Digital Diagnostics, a manufacturer of clinical diagnostic equipment. The company had doubled its plant capacity, opened new sales offices outside its home territory, and launched an expensive advertising campaign. Digital's results were not satisfactory, to put it mildly. Its board of directors, which consisted of its president and vice president plus its major stockholders (who were all local business people), was most upset when directors learned how the expansion was going. Suppliers were being paid late and were unhappy, and the bank was complaining about the cut off credit. As a result, Eddie Sanders, Digital's president, was informed that changes would have to be made, and quickly, or he would be fired. Also, at the board's insistence, John Green was brought in and given the job of assistant to Wendy Smith, a retired banker who was Digital's chairwoman and largest stockholder. Sanders agreed to give up a few of his golfing days and help nurse the company back to health, with Green's assistance. Green began by gathering financial statements and other data, shown below. The data show the dire situation that Digital Diagnostics was in after the expansion program. Thus far, sales have not been up to the forecasted level, costs have been higher than were projected, and a large loss occurred in Year 2, rather than the expected profit. Green examined monthly data for Year 2 (not given in the case), and he detected an improving pattern during the year. Monthly sales were rising costs were falling, and large losses in the early months had turned to a small profit by December. Thus, the annual data look somewhat worse than final monthly data. Also, it appears to be taking longer for the advertising program to get the message across, for the new sales offices to generate sales, and for the new manufacturing facilities to operate efficiently. In other words, the lags between spending money and deriving benefits were longer than Digital's managers had anticipated. For these reasons, Green and Sanders see hope for the company provided it can survive in the short run. $0 Green must prepare an analysis of where the company is now, what it must do to regain its financial health, and what actions should be taken. Green requested your group to complete this assigned task for him. Use this Excel Workbook to perform the quantitative parts of the analysis and prepare the report as a Word document. The report should include only the interpretations of the quantitative results. How you found these results are to be shown in this Excel Workbook. Submit both files via Blackboard as instructed. Digital Diagnostics Statement of Operations Yr 1 Actual Yr 2 Actual Yr 3 Projected Revenue: Net patient service revenue $3,432,000 $5,834,400 $7,035,600 Other revenue $0 Total revenues $3,432,000 $5,834,400 $7,035,600 Expenses: Salaries and benefits $2,864,000 $4,980,000 $5,800,000 Supplies $240,000 $620,000 $512,960 Insurance and other $50,000 $50,000 $50,000 Drugs $50,000 $50,000 $50,000 Depreciation $18,900 $116,960 $120,000 Interest $62,500 $176,000 $80,000 Total expenses $3,285,400 $5,992,960 $6,612,960 Operating income $146,600 -$158,560 $422,640 Provision for income taxes $58,640 -S63.424 $169,056 Net income $87,960 -$95,136 Digital Diagnostics Balance Sheet Yr 1 Actual Yr 2 Actual Yr 3 Projected Assets Current assets: Cash Marketable securities Net accounts receivable Inventories Total current assets Property and equipment Less accumulated depreciation Net property and equipment Total assets $9,000 $48,600 $351,200 $715,200 $1,124,000 $491,000 $146,200 $344,800 $1,468,800 S7,282 $20,000 $632,160 $1,287,360 $1,946,802 $1,202,950 $263, 160 $939,790 $2,886,592 $14,000 $71,632 $878,000 $1,716,480 $2,680,112 $1,220,000 $383.160 $836,840 $3,516,952 Liabilities and shareholders' equity Current liabilities: Accounts payable Accrued expenses Notes payable Current portion of long-term debt Total current liabilities Long-term debt Shareholders' equity: Common stock Retained earnings Total shareholders' equity Total liabilities and shareholders' equity $145,600 $136,000 $120,000 $80,000 $481,600 $323,432 $324,000 $284,960 S640,000 $80,000 $1,328,960 $1,000,000 $359,800 $380,000 $220,000 $80,000 $1,039,800 $500,000 $460,000 $203,768 $663,768 $1,468,800 $460,000 $97,632 $557,632 $2,886,592 $1,680,936 $296.216 $1,977, 152 $1.516,952 Other data: Stock price Shares outstanding Tax rate Lease payments $6.00 100,000 $12.17 250,000 $8.50 100,000 40% $40,000 40% 40% $40,000 $40,000 Industry Average Yr 1 Actual Yr 2 Actual Yr 3 Projected Profitability ratios Total margin 2.56% (87,960/3 (-1.63%) (-95,13 3.606% (253,584 / 3.6% Return on assets 5.99% (87,960/1 (-3)% (-95,136 / (7.% (253,584 / (3.4 9.0% 13.25% (87,960 / (-17.58%)(-95,13 17.90% (253,584/ 17.9% Return on equity Liquidity ratios 2.70 2.33 (1,124,000 / 1.46 (1,946,802/ 2.58 (2,680,112/ 1.01 0.45 0.79 22.0 55% 0.49 1.35 81% 1.79 -1.90 -1.24 44% 0.25 4.28 5.78 50.0% extemal libilities(total liabilities less shareholders equity/total assets) 2.5 longterm Debt/shareholders equity 6.2 operating income-interest interest 8.00 operating income-interest+Depreciation interest) 1.65 Current ratio Days cash on hand Debt management (capital structure) ratios Debt ratio Debt to equity ratio Times-interest-earned ratio Cash flow coverage ratio Asset management (activity) ratios Fixed asset turnover Total asset turnover Days sales outstanding Other ratios Average age of plant Earnings per share Book value per share Price/earnings ratio Market/book ratio 9.95 2.34 37.35 6.21 2.02 39.55 8.41 2.00 45.55 7.00 net sales /total fixed assets 2.50 nct sales /total assets 32.0 Accounts receivable/(annual sales/365) 6.1 pla n/a 16.20 2.90 Digital Diagnostics
Step by Step Solution
There are 3 Steps involved in it

Get step-by-step solutions from verified subject matter experts