

Question: Please help me with these questions PLEASE WRITE YOUR RESPONSES ON PAPER. SHOW AS MANY STEPS AS NEEDED TO JUSTIFY YOUR ANSWER. SCAN AND UPLOAD.

Please help me with these questions
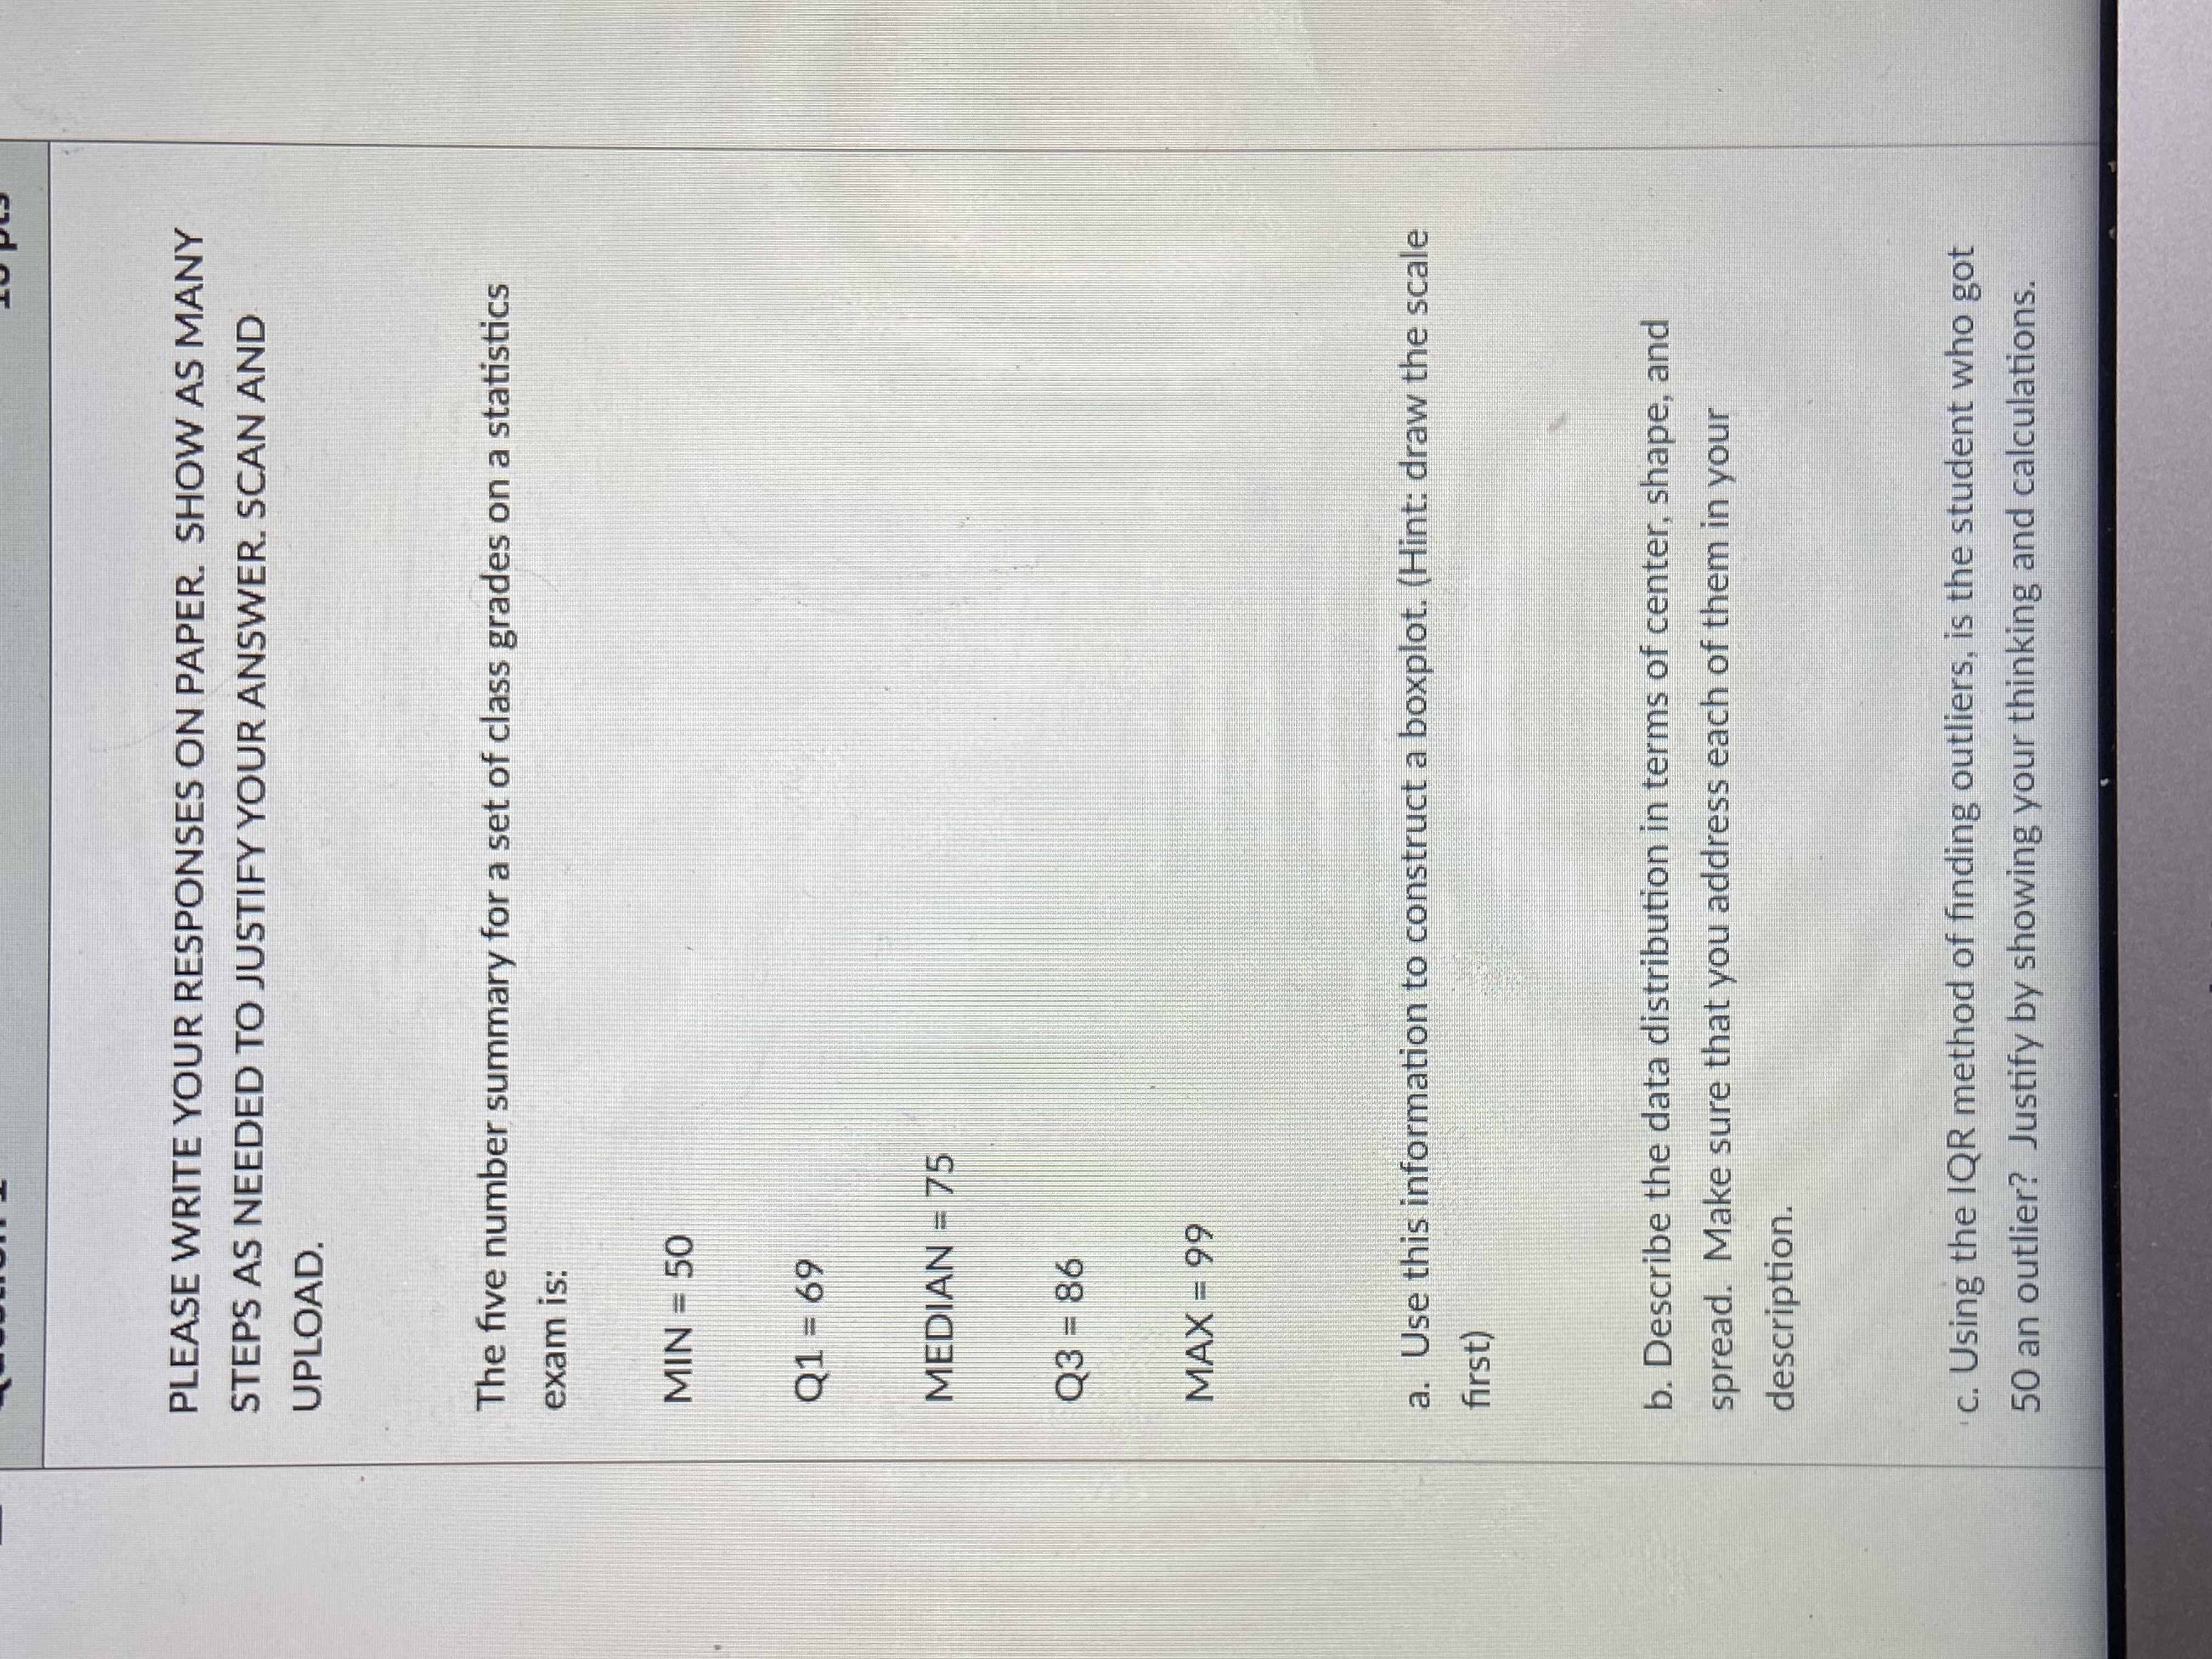
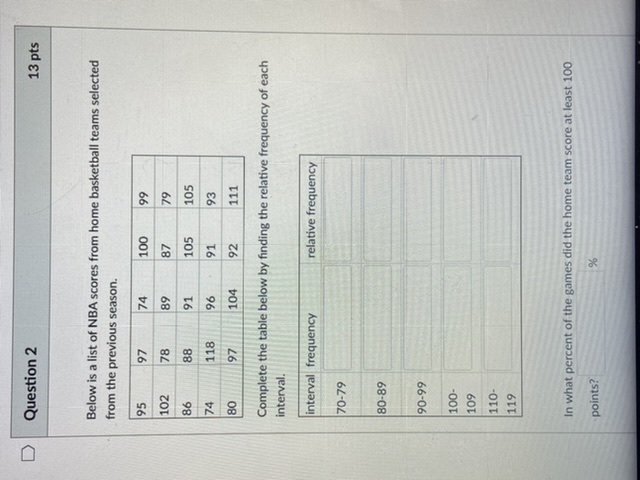
PLEASE WRITE YOUR RESPONSES ON PAPER. SHOW AS MANY STEPS AS NEEDED TO JUSTIFY YOUR ANSWER. SCAN AND UPLOAD. The five number summary for a set of class grades on a statistics exam is: MIN - 50 Q1- 69 MEDIAN = 75 Q3 - 86 MAX = 99 a. Use this information to construct a boxplot. (Hint: draw the scale first) b. Describe the data distribution in terms of center, shape, and spread. Make sure that you address each of them in your description. c. Using the IQR method of finding outliers, is the student who got 50 an outlier? Justify by showing your thinking and calculations.Question 2 13 pts Below is a list of NBA scores from home basketball teams selected from the previous season. 95 100 102 86 8 105 105 118 104 Complete the table below by finding the relative frequency of each interval. interval frequency relative frequency 70-79 80-89 90-99 100- 109 110- 119 In what percent of the games did the home team score at least 100 points
Step by Step Solution
There are 3 Steps involved in it

Get step-by-step solutions from verified subject matter experts