

Question: Please help me with this questions please PLEASE WRITE YOUR RESPONSES ON PAPER. SHOW AS MANY STEPS AS NEEDED TO JUSTIFY YOUR ANSWER. SCAN AND
Please help me with this questions please
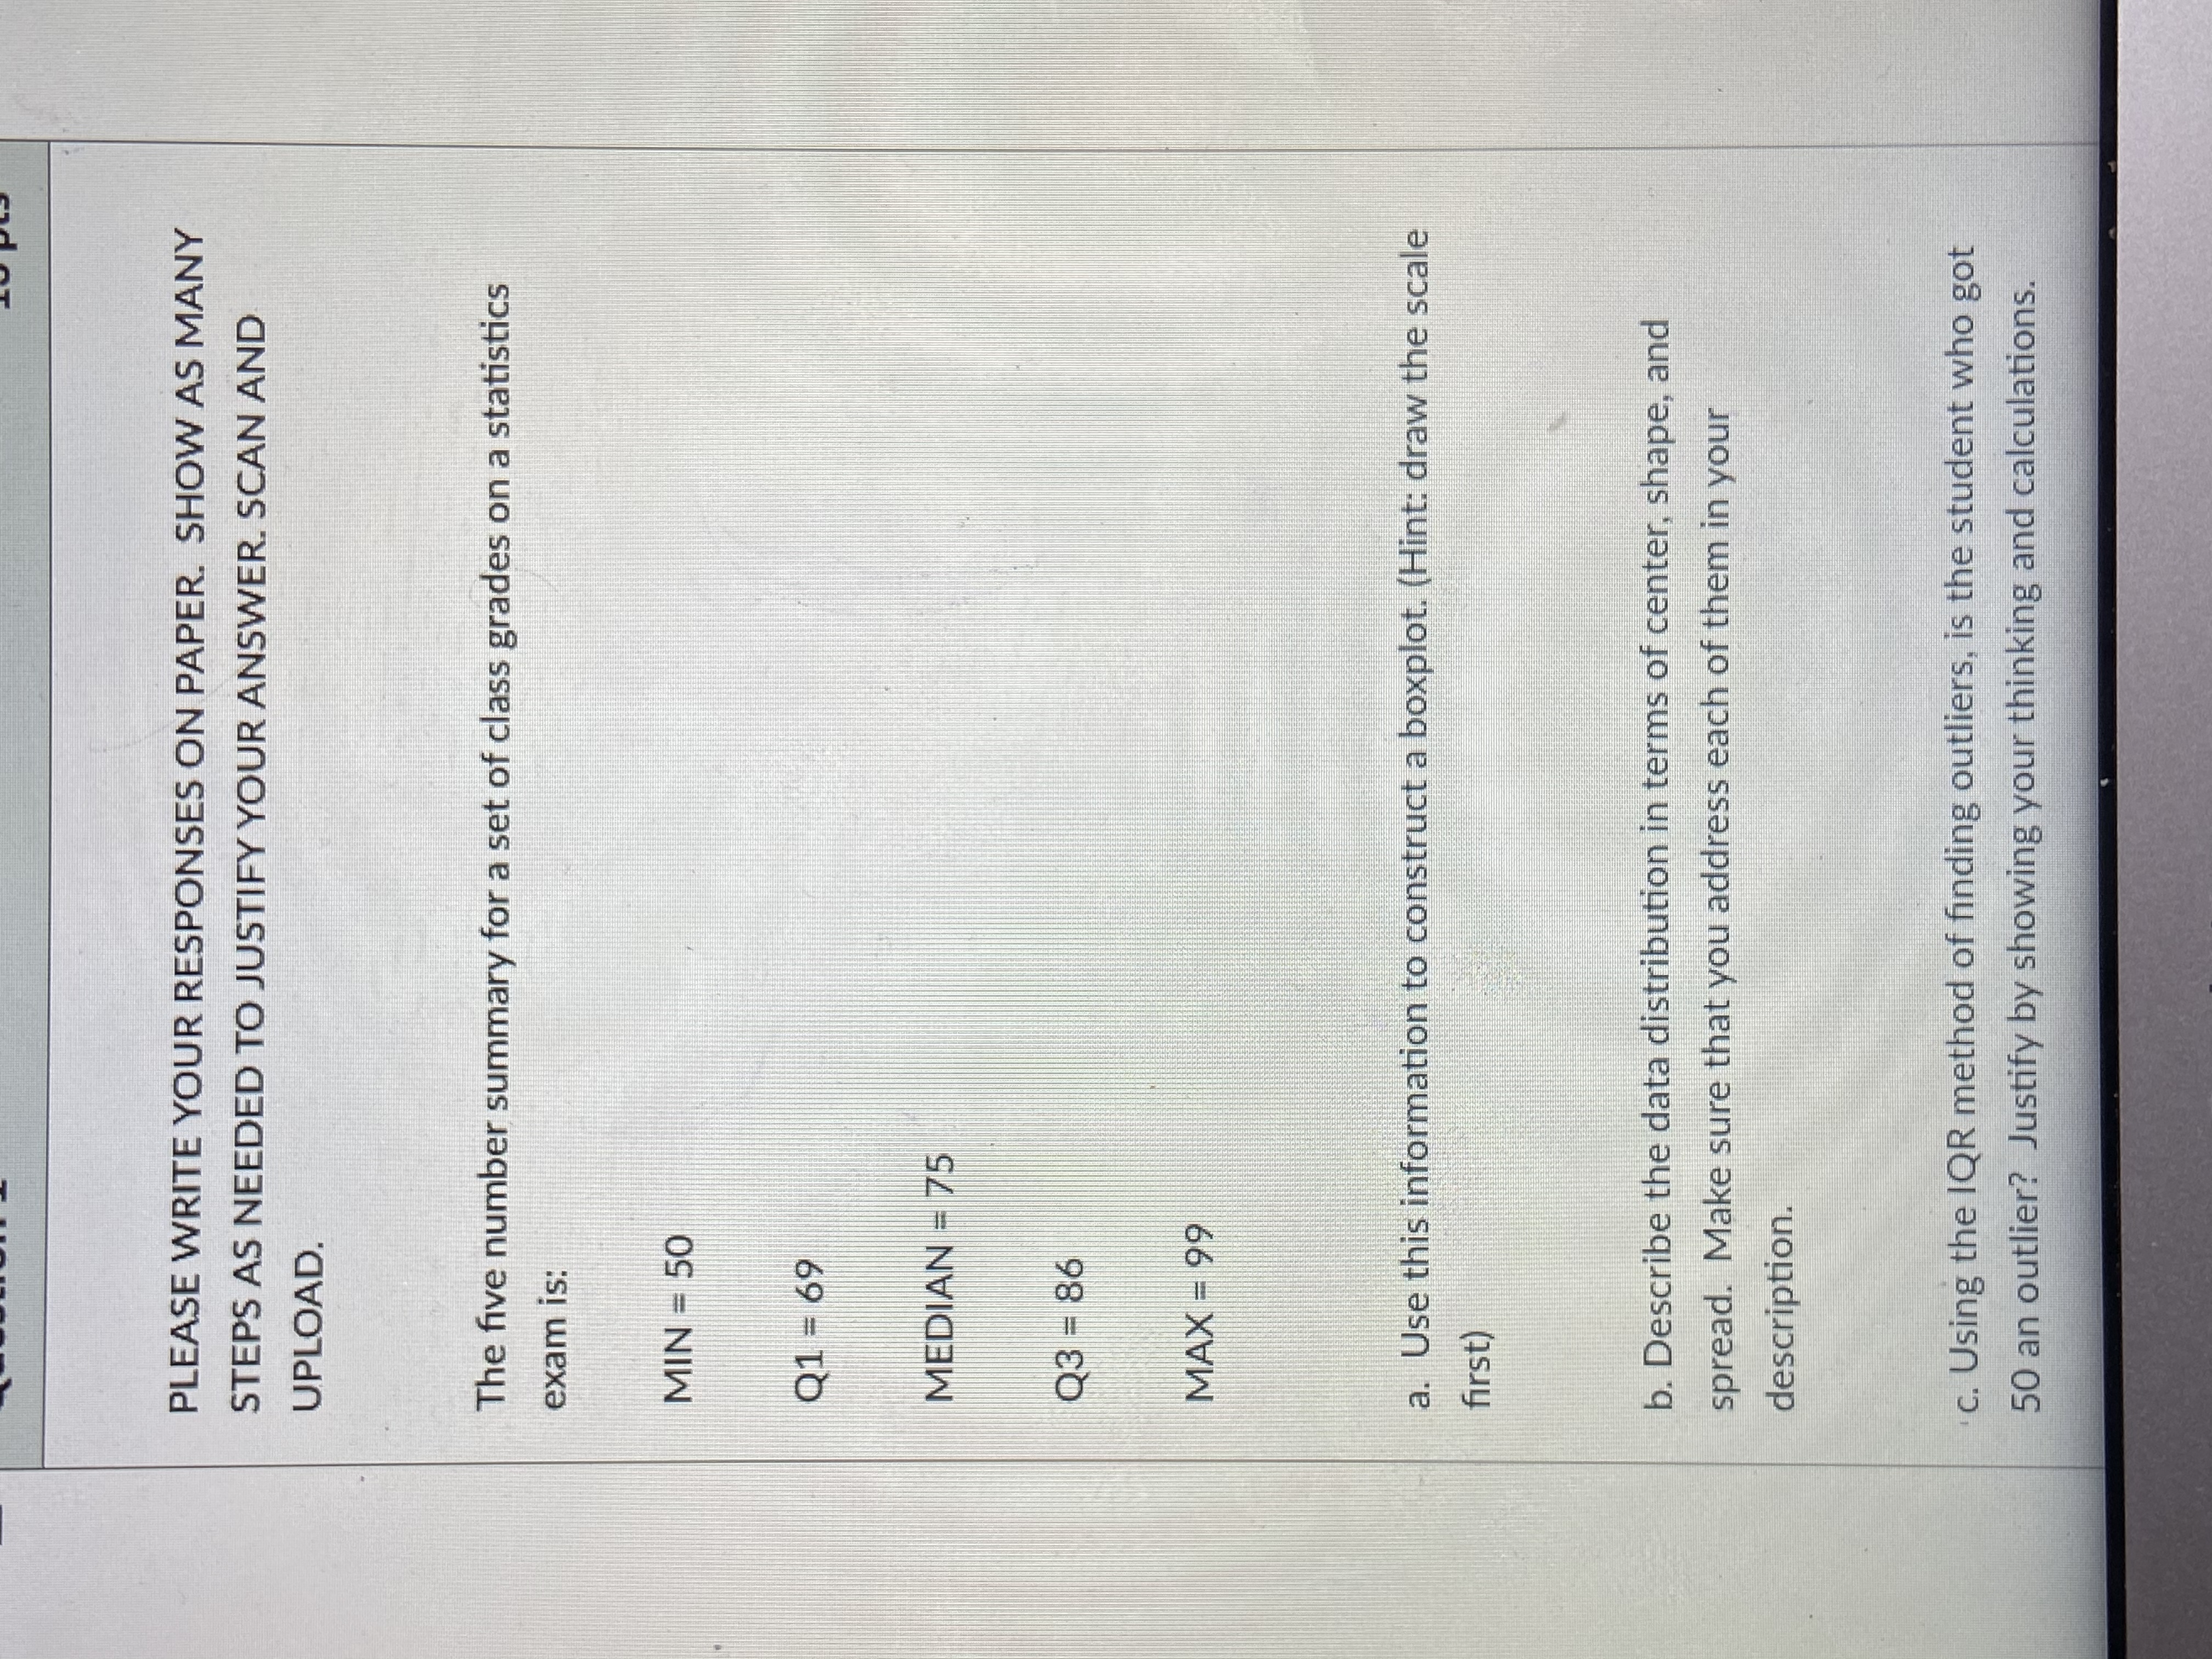
PLEASE WRITE YOUR RESPONSES ON PAPER. SHOW AS MANY STEPS AS NEEDED TO JUSTIFY YOUR ANSWER. SCAN AND UPLOAD. The five number summary for a set of class grades on a statistics exam is: MIN - 50 Q1- 69 MEDIAN = 75 Q3 - 86 MAX = 99 a. Use this information to construct a boxplot. (Hint: draw the scale first) b. Describe the data distribution in terms of center, shape, and spread. Make sure that you address each of them in your description. c. Using the IQR method of finding outliers, is the student who got 50 an outlier? Justify by showing your thinking and calculations
Step by Step Solution
There are 3 Steps involved in it
1 Expert Approved Answer
Step: 1 Unlock

Question Has Been Solved by an Expert!
Get step-by-step solutions from verified subject matter experts
Step: 2 Unlock
Step: 3 Unlock