

Question: please help me with this practice lab, it will be very good study guide for my midterm fExercise 1: Do you think that there is
please help me with this practice lab, it will be very good study guide for my midterm
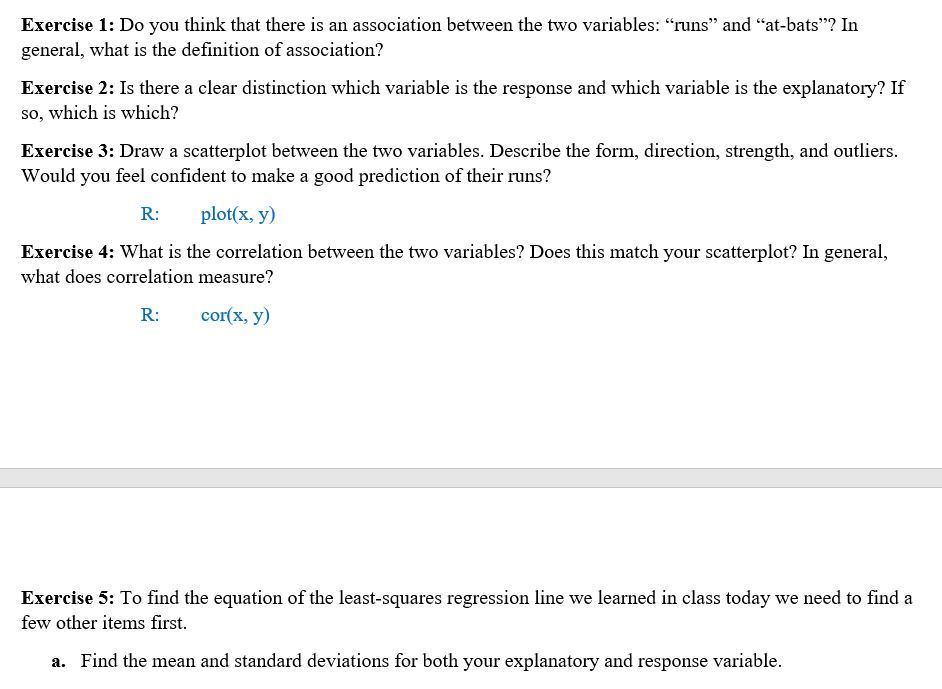

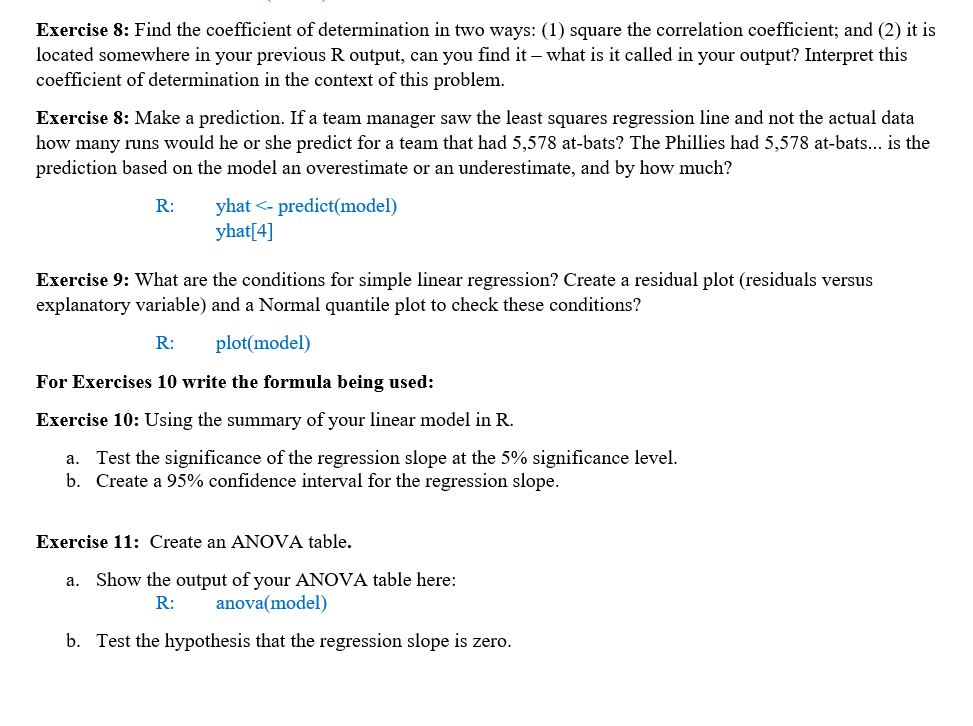
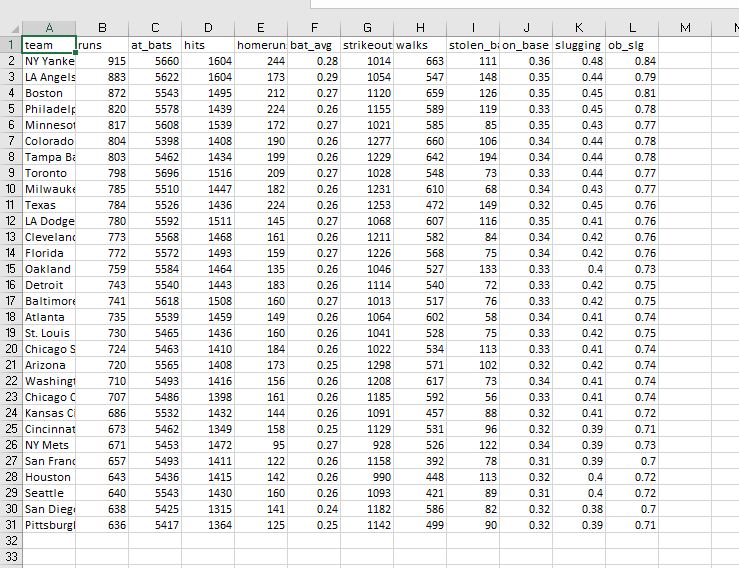
\fExercise 1: Do you think that there is an association between the two variables: \"runs\" and \"at-bats"? in general, what is the denition of association? Exercise 2: Is there a clear distinction which variable is the response and which variable is the explanatory? If so, which is which? Exercise 3: Draw a scatterplot between the two variables. Describe the fonn, direction, strength and outliers. Would you feel condent to make a good prediction of their runs? R: plot(x, y) Exercise 4: \"That is the correlation between the two variables? Does this match your scatter-plot? In general, What does correlation measure? R: cor(x, y) Exercise 5: To nd the equation of the least-squares regression line we learned in class today we need to nd a few other items rst. :1. Find the mean and standard deviations for both your explanatory and response variable. Exercise 5: To nd the equation of the least-squares regression line we learned in class today we need to nd a few other items rst. :1. Find the mean and standard deviations for both your explanatory and response variable. R1 DEMO; 94:10 I). Find the slope of the least-squares regression line. Interpret the slope. c. Find the intercept of the least-squares regression line. Interpret the intercept. (1. Write out the least-squares regression line. Exercise 6: We can use R to find the least-squares line with a single command. Copy the output from this command below. R: model 4- l.m(y~x., data = dat) model summarmodel) Exercise 7: Plot the least-squares line on your scatterplot. R: plot{x,y) abline(model) Exercise 8: Find the coecient of determination in two ways: (1) square the correlation coefcient; and (2) it is located somewhere in your previous R output, can you nd it what is it called in your output? Interpret this coecient of determination in the context of this problem. Exercise 8: Make a prediction. Ifa team manager saw the least squares regression line and not the actual data how many runs would he or she predict for a team that had 5,578 at-bats? The Phillies had 5,578 at-bats... is the prediction based on the model an overestimate or an underestimate, and by how much? R: yhat - predict(model) yhat[4] Exercise 9: Mat are the conditions for simple linear regression? Create a residual plot (residuals versus explanatory variable) and a Normal quantile plot to check these conditions? R: plot{model)
Step by Step Solution
There are 3 Steps involved in it

Get step-by-step solutions from verified subject matter experts