

Question: Please help me with this problem I been stuck in this problem for 45 min and don't know how to go about it ???? 2.
Please help me with this problem I been stuck in this problem for 45 min and don't know how to go about it ????
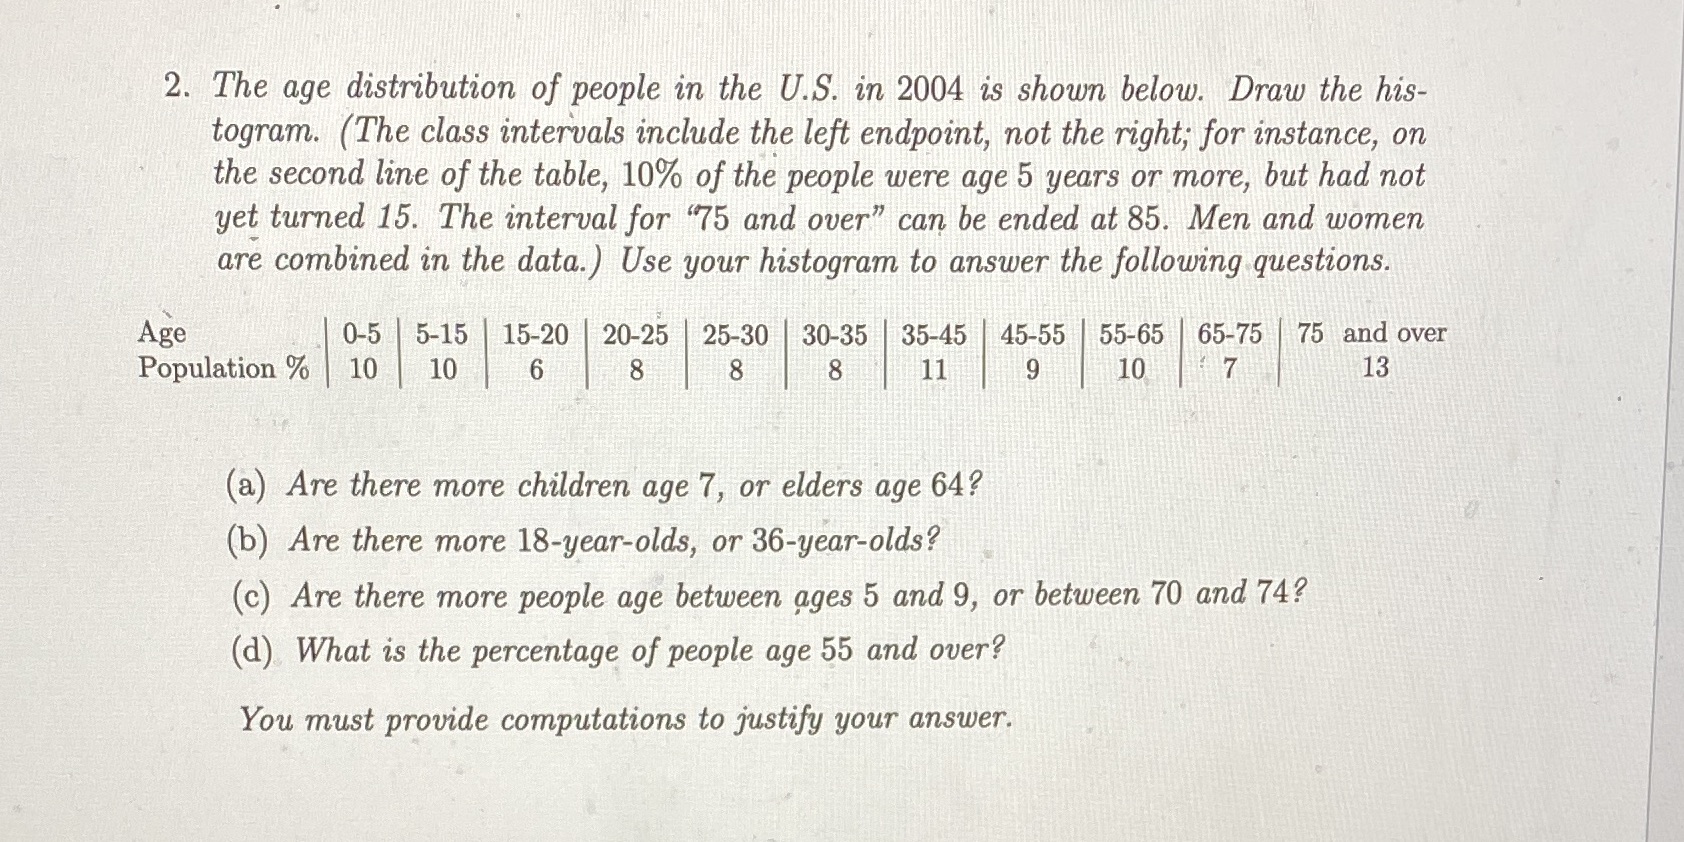
2. The age distribution of people in the U.S. in 2004 is shown below. Draw the his- togram. (The class intervals include the left endpoint, not the right; for instance, on the second line of the table, 10% of the people were age 5 years or more, but had not yet turned 15. The interval for "75 and over" can be ended at 85. Men and women are combined in the data. ) Use your histogram to answer the following questions. Age 0-5 5-15 15-20 20-25 25-30 30-35 35-45 45-55 55-65 65-75 75 and over Population % 10 6 8 8 8 11 9 10 7 13 (a) Are there more children age 7, or elders age 64? (b) Are there more 18-year-olds, or 36-year-olds? (c) Are there more people age between ages 5 and 9, or between 70 and 74? (d) What is the percentage of people age 55 and over? You must provide computations to justify your
Step by Step Solution
There are 3 Steps involved in it

Get step-by-step solutions from verified subject matter experts