

Question: Please help me with this problem I been stuck in this problem for 45 min and don't know how to go about it ???? 1.
Please help me with this problem I been stuck in this problem for 45 min and don't know how to go about it ????
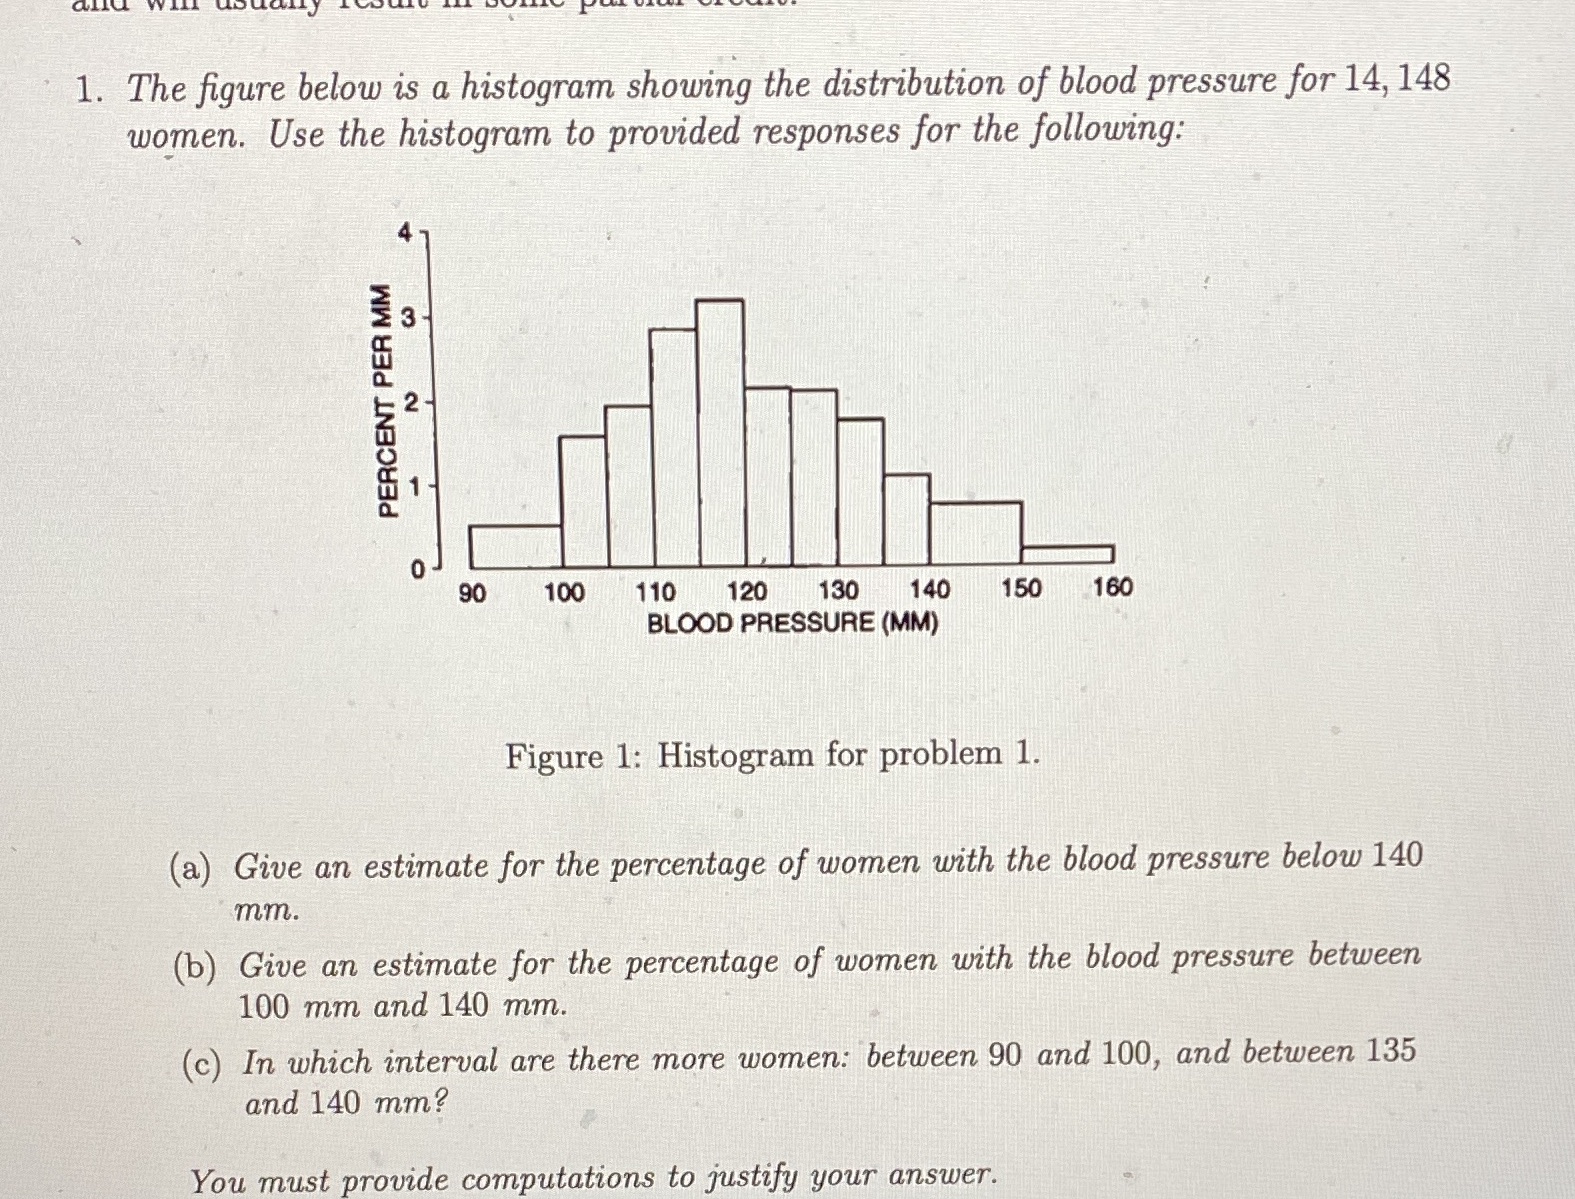
1. The figure below is a histogram showing the distribution of blood pressure for 14, 148 women. Use the histogram to provided responses for the following: PERCENT PER MM N 90 100 110 120 130 140 150 160 BLOOD PRESSURE (MM) Figure 1: Histogram for problem 1. (a) Give an estimate for the percentage of women with the blood pressure below 140 mm. (b) Give an estimate for the percentage of women with the blood pressure between 100 mm and 140 mm. (c) In which interval are there more women: between 90 and 100, and between 135 and 140 mm? You must provide computations to justify your
Step by Step Solution
There are 3 Steps involved in it

Get step-by-step solutions from verified subject matter experts