

Question: I failed to understand what this paragraph was trying to tell me, especially the graph, please explain. EXPECTED UTILITY AND THE RATIONAL CHOICE MODEL You
I failed to understand what this paragraph was trying to tell me, especially the graph, please explain.
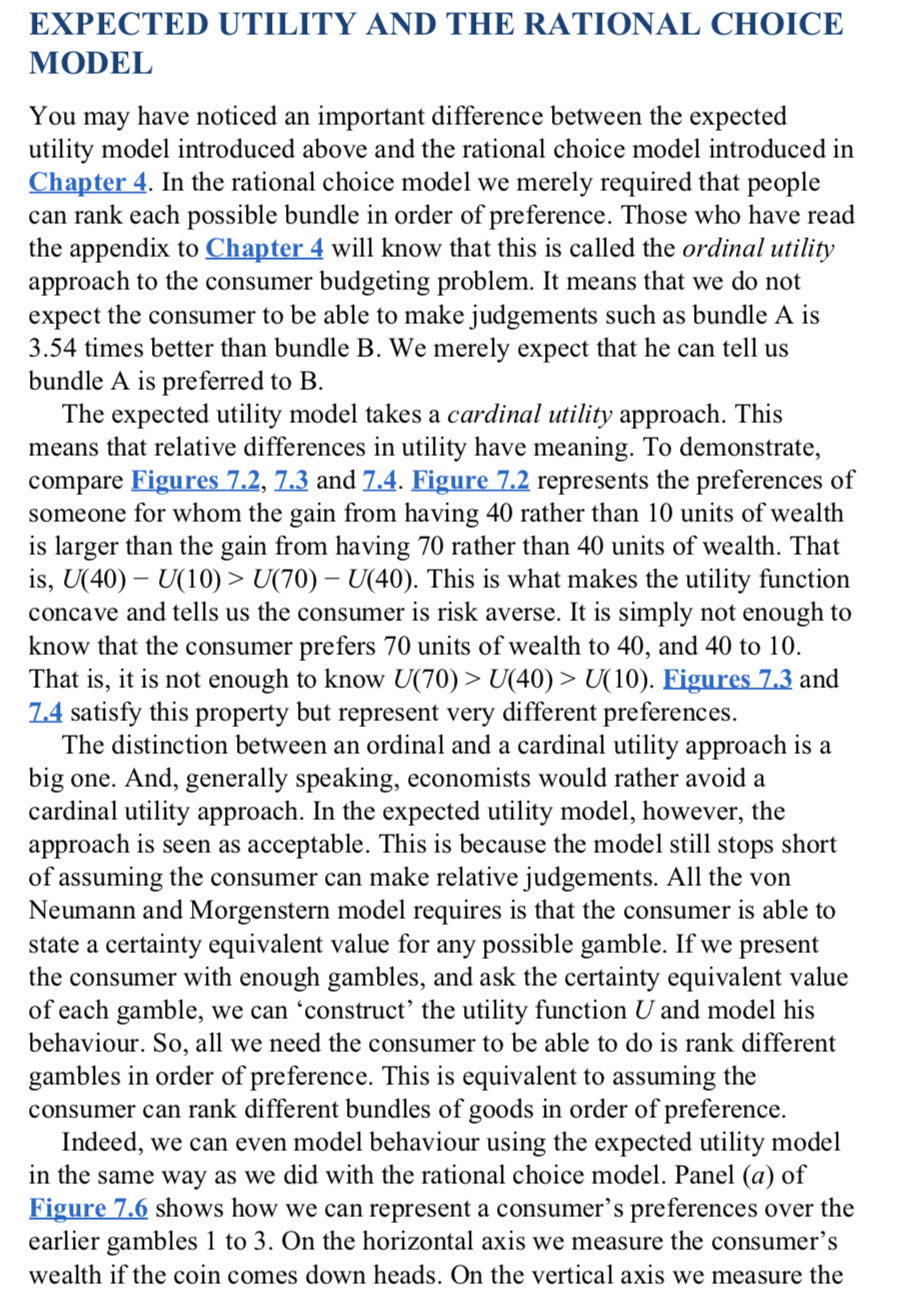
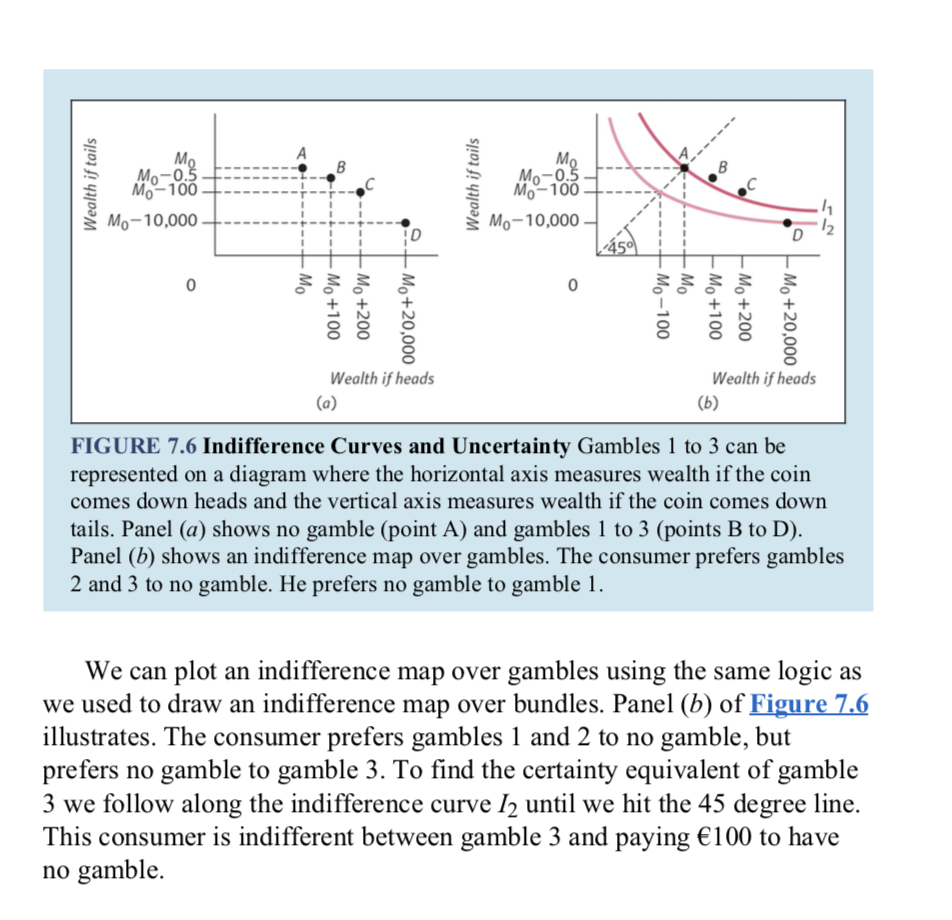
EXPECTED UTILITY AND THE RATIONAL CHOICE MODEL You may have noticed an important difference between the expected utility model introduced above and the rational choice model introduced in EMBLEM- In the rational choice model we merely required that people can rank each possible bundle in order of preference. Those who have read the appendix to Charmed will know that this is called the ordinal utility approach to the consumer budgeting problem. It means that we do not expect the consumer to be able to make judgements such as bundle A is 3.54 times better than bundle B. We merely expect that he can tell us bundle A is preferred to B. The expected utility model takes a cardinai utifity approach. This means that relative differences in utility have meaning. To demonstrate, compare w, 1.3 and 1.5. W represents the preferences of someone for whom the gain from having 40 rather than 10 units of wealth is larger than the gain from having 70 rather than 40 units of wealth. That is, U(40) - U(10)> U(70) - U(40). This is what makes the utility mction concave and tells us the consumer is risk averse. It is simply not enough to know that the consumer prefers 70 units of wealth to 40, and 40 to 10. That is, it is not enough to know U(70) > U(40) > U( 10). Eigumsll and 1A satisfy this property but represent very different preferences. The distinction between an ordinal and a cardinal utility approach is a big one. And, generally speaking, economists would rather avoid a cardinal utility approach. In the expected utility model, however, the approach is seen as acceptable. This is because the model still stops short of assuming the consumer can make relative judgements. All the von Neumann and Morgenstem model requires is that the consumer is able to state a certainty equivalent value for any possible gamble. If we present the consumer with enough gambles, and ask the certainty equivalent value of each gamble, we can 'construct' the utility function U and model his behaviour. So, all we need the consumer to be able to do is rank different gambles in order of preference. This is equivalent to assuming the consumer can rank different bundles of goods in order of preference. Indeed, we can even model behaviour using the expected utility model in the same way as we did with the rational choice model. Panel (a) of EiguLL'L shows how we can represent a consumer's preferences over the earlier gambles l to 3. On the horizontal axis we measure the consumer's wealth if the coin comes down heads. On the vertical axis we measure the Wealth if heads Wealth if heads (a) (b) FIGURE 7.6 Indifference Curves and Uncertainty Gambles 1 to 3 can be represented on a diagram where the horizontal axis measures wealth if the coin comes down heads and the vertical axis measures wealth if the coin comes down tails. Panel (a) shows no gamble (point A) and gambles l to 3 (points B to D). Panel (b) shows an indifference map over gambles. The consumer prefers gamble: 2 and 3 to no gamble. He prefers no gamble to gamble 1. We can plot an indifference map over gambles using the same logic as we used to draw an indifference map over bundles. Panel (b) of HM illustrates. The consumer prefers gambles l and 2 to no gamble, but prefers no gamble to gamble 3. To nd the certainty equivalent of gamble 3 we follow along the indifference curve 12 until we hit the 45 degree line. This consumer is indifferent between gamble 3 and paying 100 to have no gamble
Step by Step Solution
There are 3 Steps involved in it

Get step-by-step solutions from verified subject matter experts