

Question: Please help me with this question. Thank you Using the data in the following table, estimate the: a. Average return and volatility for each stock.
Please help me with this question. Thank you
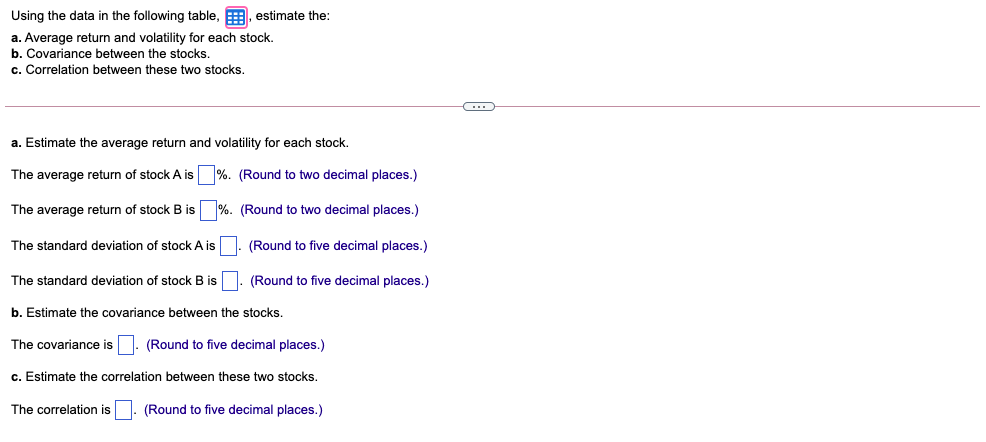
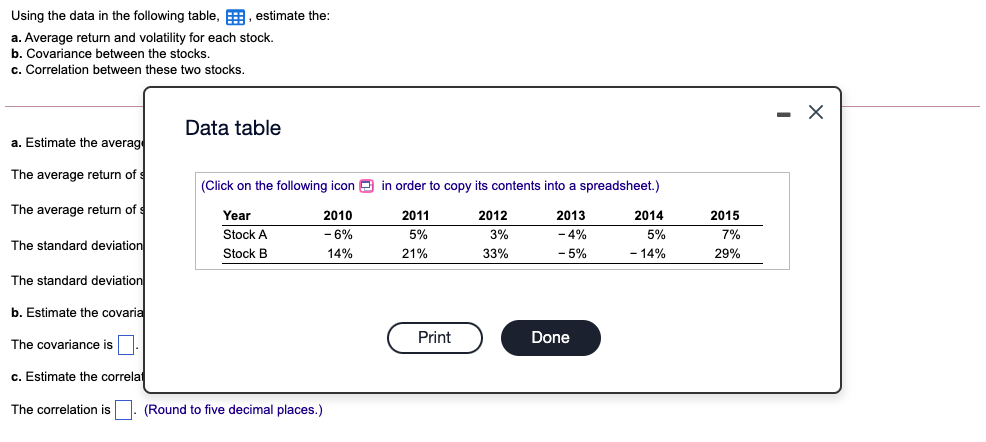
Using the data in the following table, estimate the: a. Average return and volatility for each stock. b. Covariance between the stocks. c. Correlation between these two stocks. .. a. Estimate the average return and volatility for each stock. The average return of stock A is %. (Round to two decimal places.) The average return of stock B is %. (Round to two decimal places.) The standard deviation of stock A is (Round to five decimal places.) The standard deviation of stock B is (Round to five decimal places.) b. Estimate the covariance between the stocks. The covariance is (Round to five decimal places.) c. Estimate the correlation between these two stocks. The correlation is (Round to five decimal places.) Using the data in the following table, estimate the: a. Average return and volatility for each stock. b. Covariance between the stocks. c. Correlation between these two stocks. Data table a. Estimate the averag The average return of (Click on the following icon in order to copy its contents into a spreadsheet.) The average return of Year Stock A Stock B 2010 -6% 14% 2011 5% 21% 2012 3% 33% 2013 -4% - 5% 2014 5% - 14% 2015 7% 29% The standard deviation The standard deviation b. Estimate the covaria Print Done The covariance is c. Estimate the correla The correlation is (Round to five decimal places.)
Step by Step Solution
There are 3 Steps involved in it

Get step-by-step solutions from verified subject matter experts