

Question: Please help me with this RStudio homework. Homework 1 Prepare a report for following tasks using techniques you learnt from the class. You report should
Please help me with this RStudio homework. 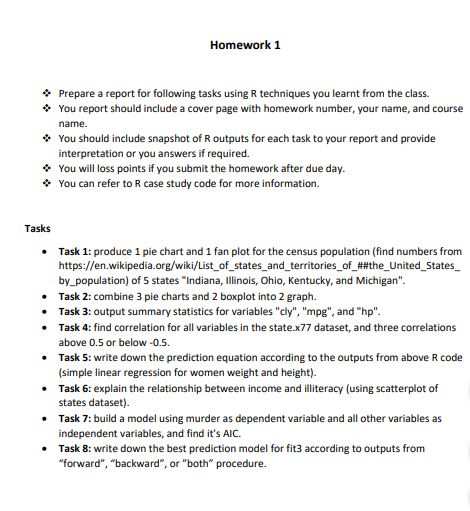
Homework 1 Prepare a report for following tasks using techniques you learnt from the class. You report should include a cover page with homework number, your name, and course name. > You should include snapshot of R outputs for each task to your report and provide interpretation or you answers if required. You will loss points if you submit the homework after due day. You can refer to R case study code for more information. Tasks Task 1: produce 1 pie chart and 1 fan plot for the census population (find numbers from https://en.wikipedia.org/wiki/List_of_states_and_territories_of_the_United_States by population) of 5 states "indiana, Illinois, Ohio, Kentucky, and Michigan". Task 2: combine 3 pie charts and 2 boxplot into 2 graph. Task 3: output summary statistics for variables "ely", "mpg", and "hp". Task 4: find correlation for all variables in the state.x77 dataset, and three correlations above 0.5 or below -0.5. Task 5: write down the prediction equation according to the outputs from above R code (simple linear regression for women weight and height) Task 6: explain the relationship between income and illiteracy (using scatterplot of states dataset). Task 7: build a model using murder as dependent variable and all other variables as independent variables, and find it's AIC. Task 8: write down the best prediction model for fit3 according to outputs from "forward","backward", or "both procedure. Homework 1 Prepare a report for following tasks using techniques you learnt from the class. You report should include a cover page with homework number, your name, and course name. > You should include snapshot of R outputs for each task to your report and provide interpretation or you answers if required. You will loss points if you submit the homework after due day. You can refer to R case study code for more information. Tasks Task 1: produce 1 pie chart and 1 fan plot for the census population (find numbers from https://en.wikipedia.org/wiki/List_of_states_and_territories_of_the_United_States by population) of 5 states "indiana, Illinois, Ohio, Kentucky, and Michigan". Task 2: combine 3 pie charts and 2 boxplot into 2 graph. Task 3: output summary statistics for variables "ely", "mpg", and "hp". Task 4: find correlation for all variables in the state.x77 dataset, and three correlations above 0.5 or below -0.5. Task 5: write down the prediction equation according to the outputs from above R code (simple linear regression for women weight and height) Task 6: explain the relationship between income and illiteracy (using scatterplot of states dataset). Task 7: build a model using murder as dependent variable and all other variables as independent variables, and find it's AIC. Task 8: write down the best prediction model for fit3 according to outputs from "forward","backward", or "both procedure
Step by Step Solution
There are 3 Steps involved in it

Get step-by-step solutions from verified subject matter experts