

Question: Please help me with this; The two-way relative frequency table below shows hypothetical data on female life expectancy at birth in various countries. Age Relative
Please help me with this;
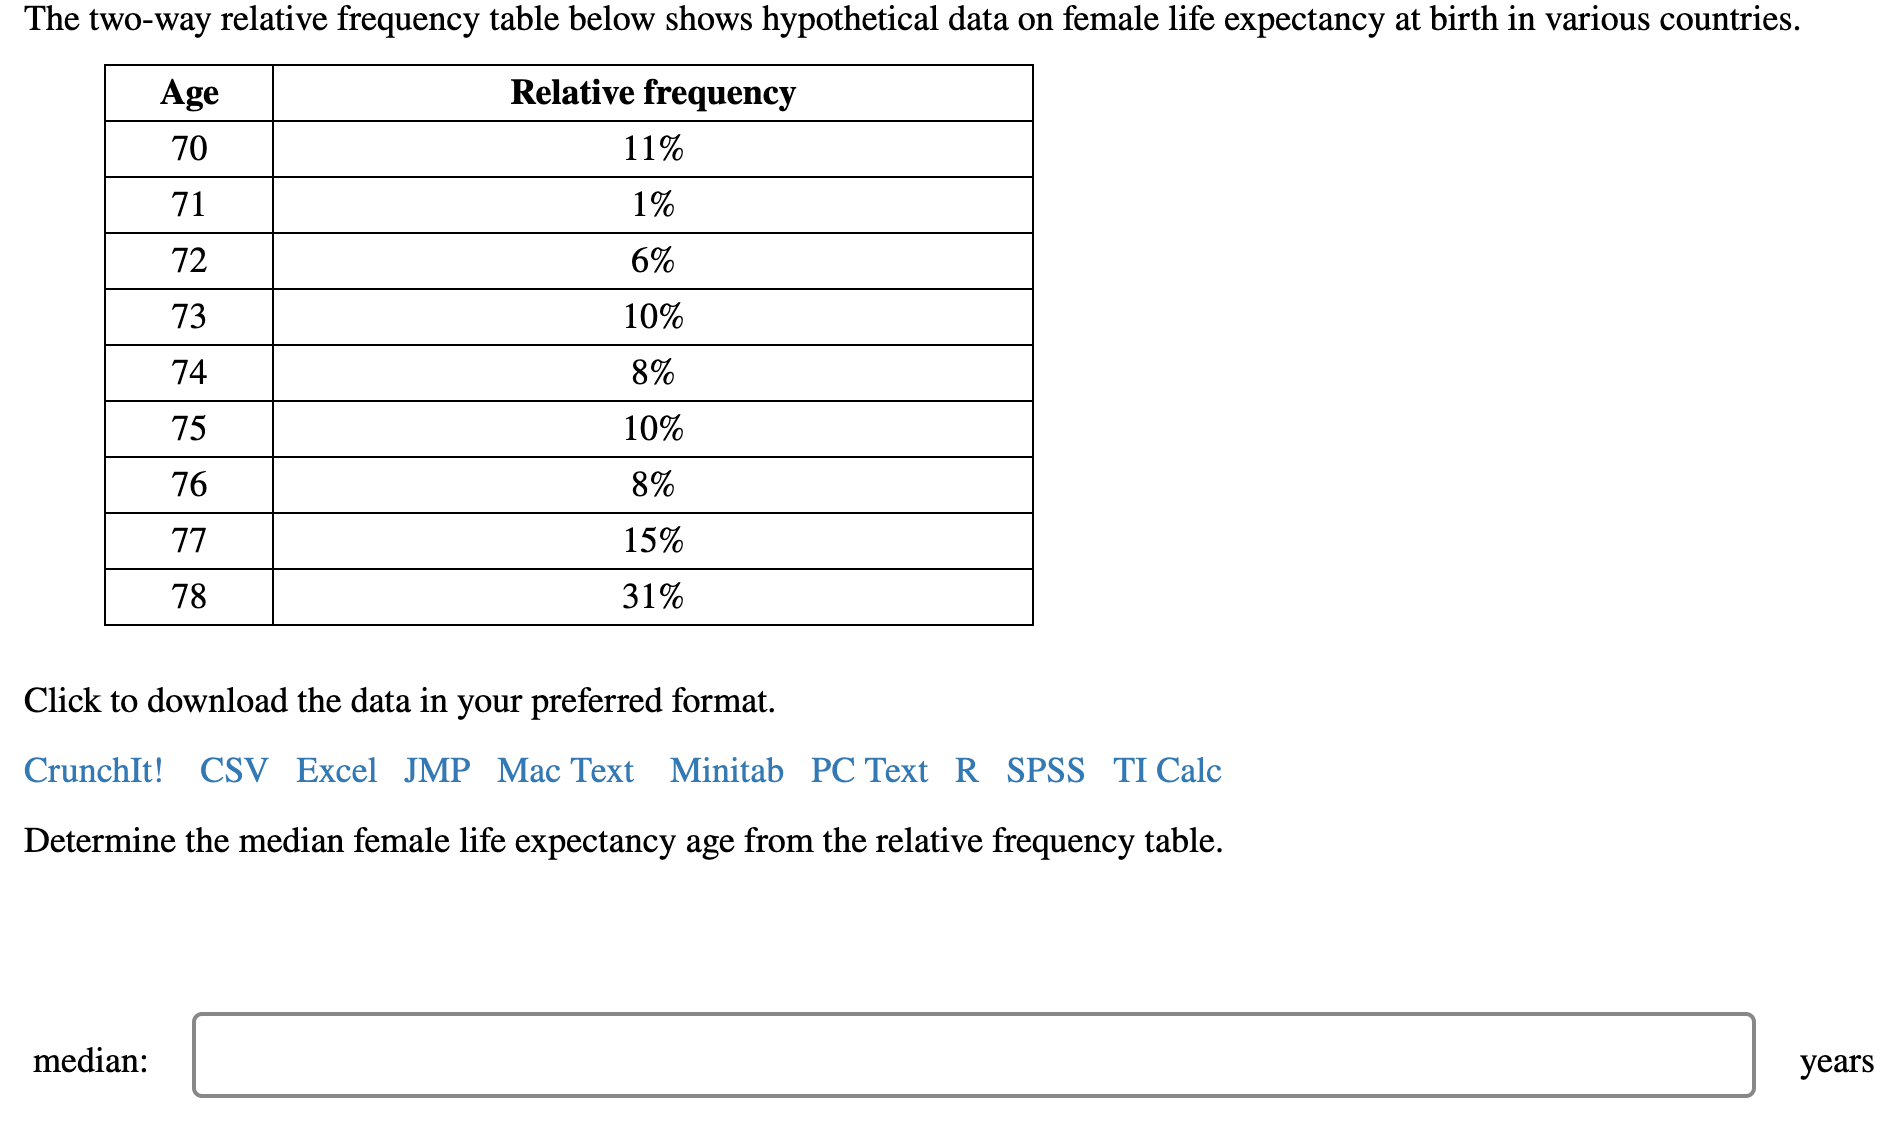
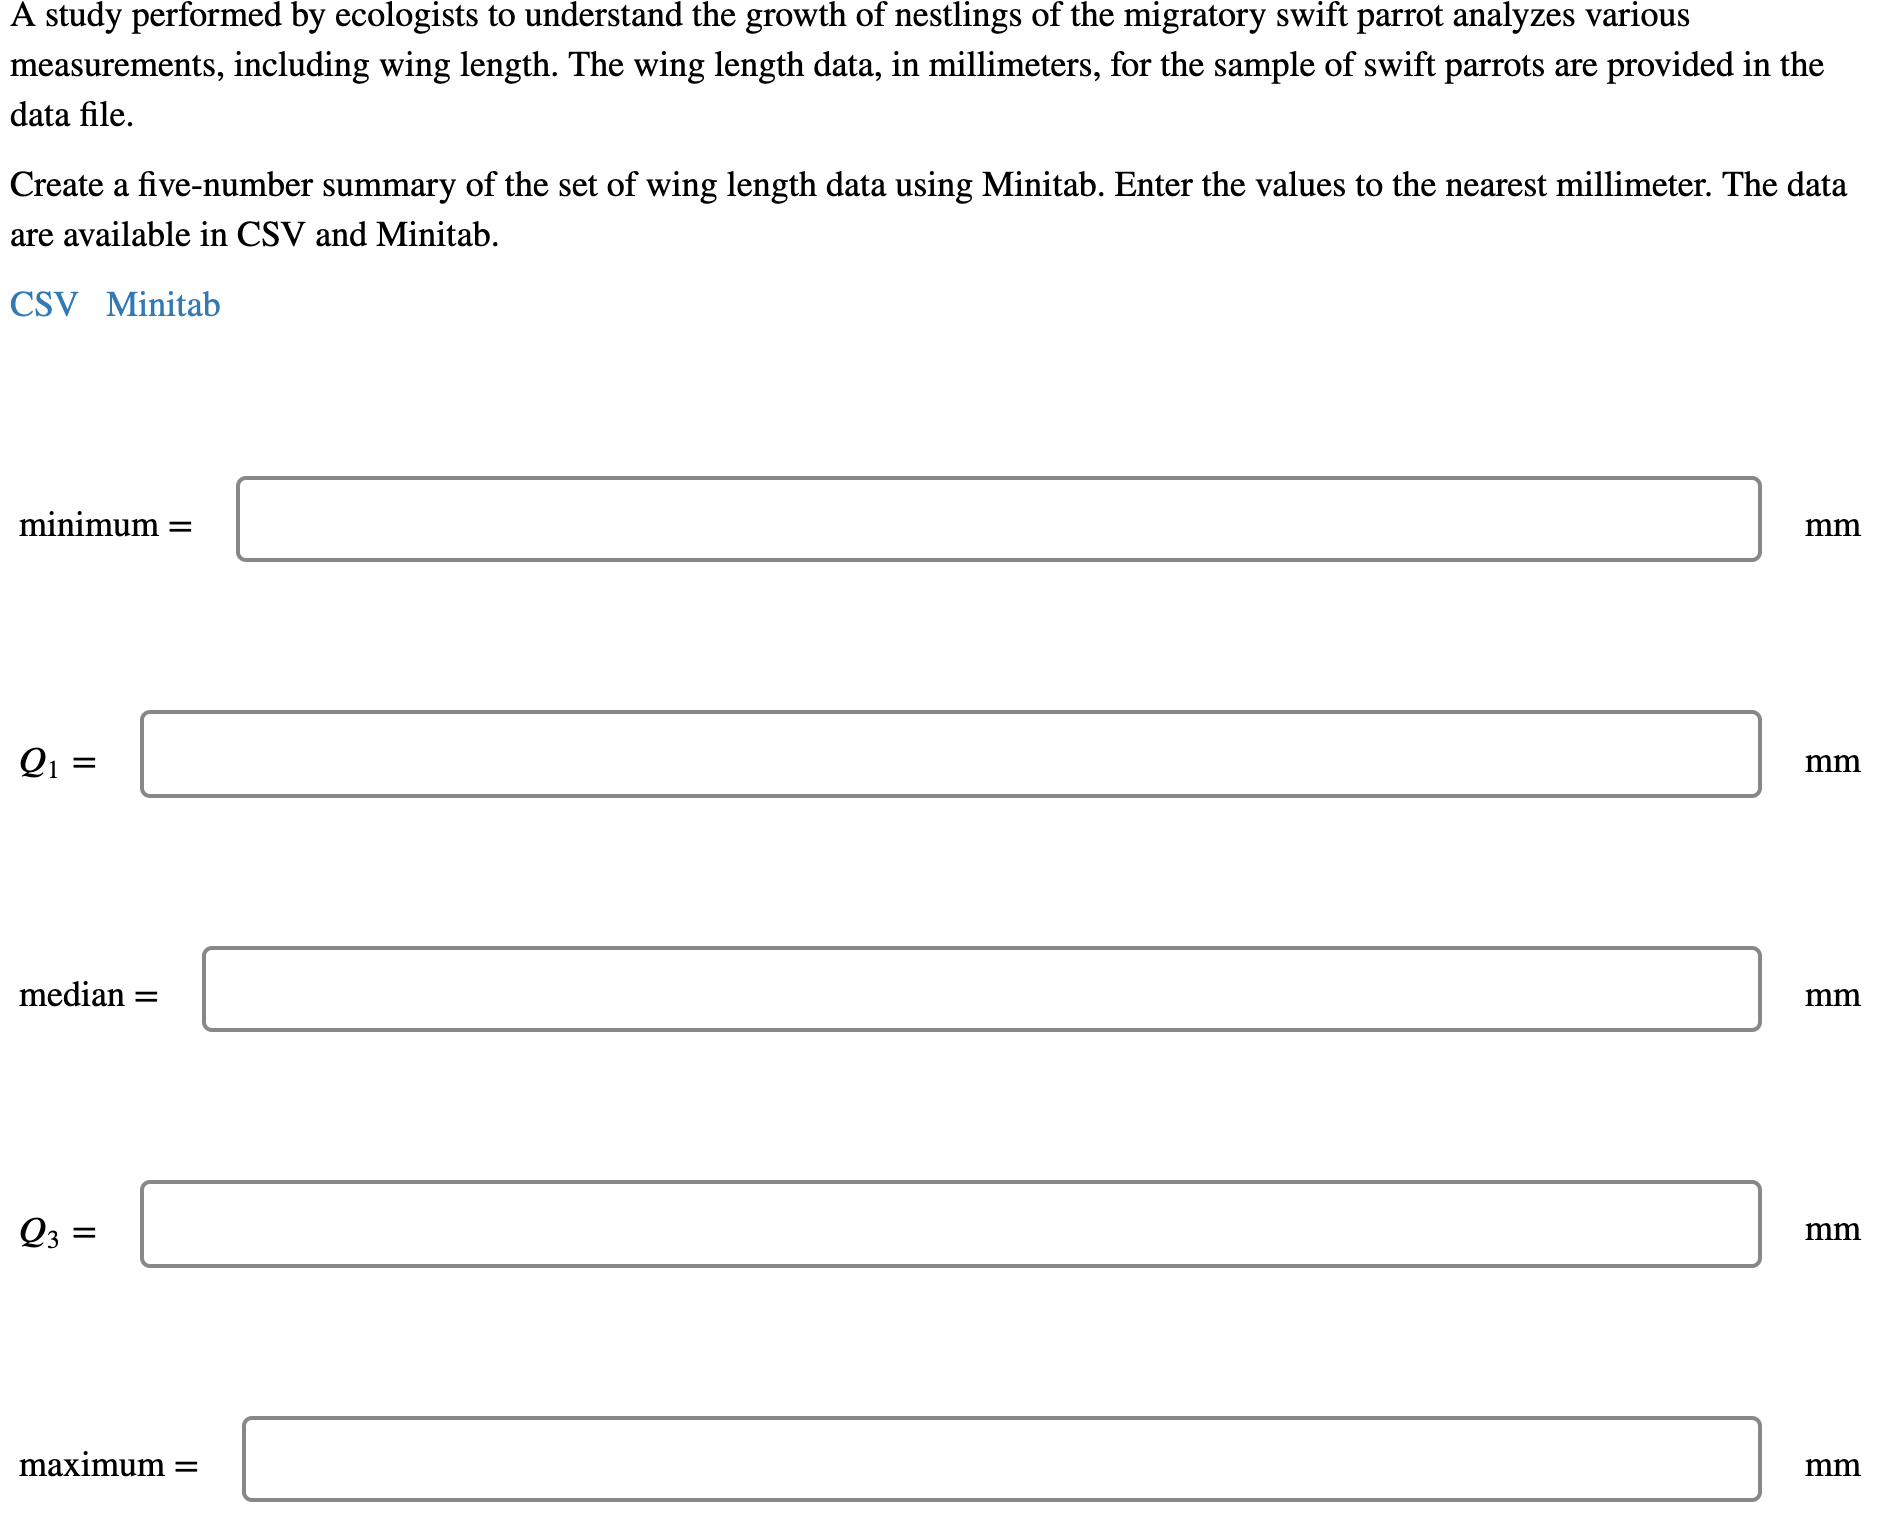
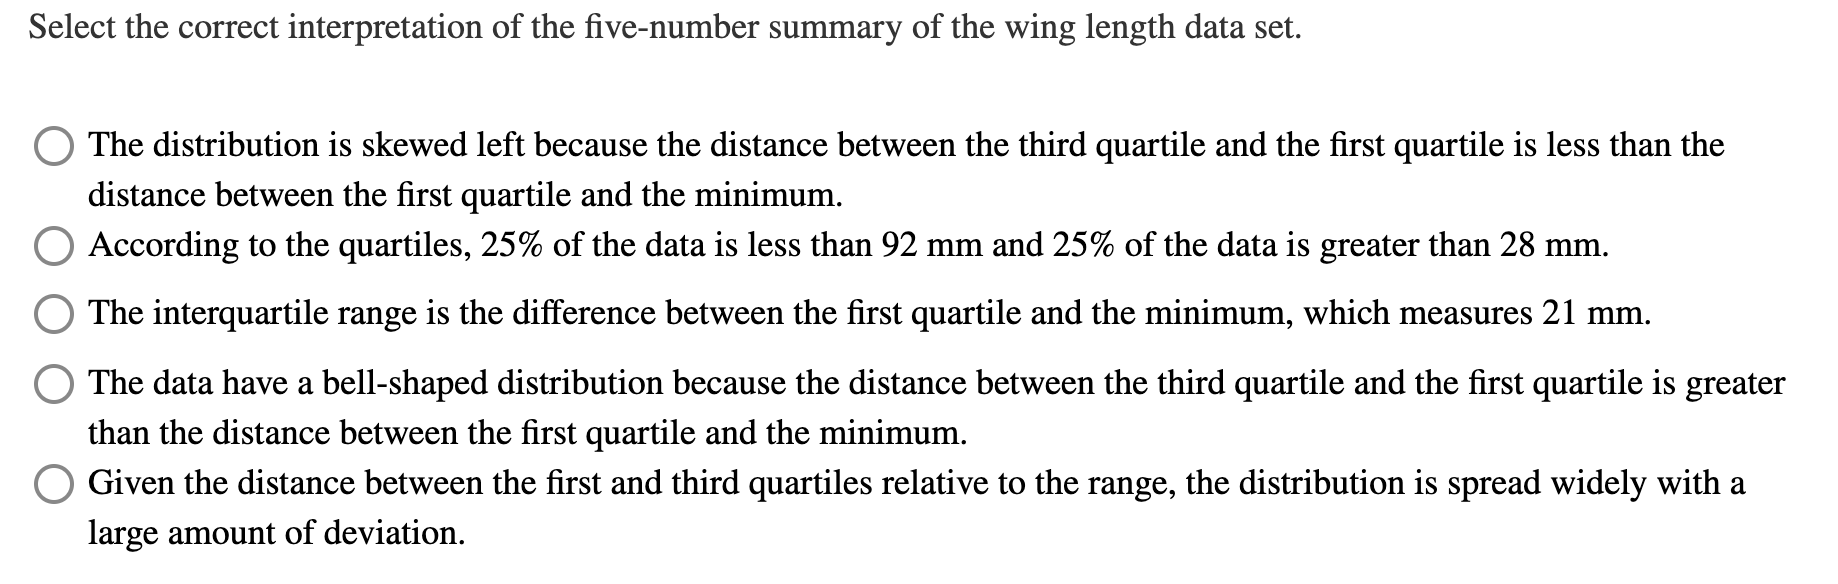
The two-way relative frequency table below shows hypothetical data on female life expectancy at birth in various countries. Age Relative frequency 70 11% 71 1% 72 6% 73 10% 74 8% 75 10% 76 8% 77 15% 78 31% Click to download the data in your preferred format. CrunchIt! CSV Excel JMP Mac Text Minitab PC Text R SPSS TI Calc Determine the median female life expectancy age from the relative frequency table. median: yearsA study performed by ecologists to understand the growth of nestlings of the migratory swift parrot analyzes various measurements, including wing length. The Wing length data, in millimeters, for the sample of swift parrots are provided in the data le. Create a ve-number summary of the set of wing length data using Minitab. Enter the values to the nearest millimeter. The data are available in CSV and Minitab. CSV Minitab minimum: Q1 mm mm mm Select the correct interpretation of the five-number summary of the wing length data set. O The distribution is skewed left because the distance between the third quartile and the first quartile is less than the distance between the first quartile and the minimum. According to the quartiles, 25% of the data is less than 92 mm and 25% of the data is greater than 28 mm. The interquartile range is the difference between the first quartile and the minimum, which measures 21 mm. O The data have a bell-shaped distribution because the distance between the third quartile and the first quartile is greater than the distance between the first quartile and the minimum. O Given the distance between the first and third quartiles relative to the range, the distribution is spread widely with a large amount of deviation
Step by Step Solution
There are 3 Steps involved in it

Get step-by-step solutions from verified subject matter experts