

Question: Please help meThe select box options are increased and decreased A graph of a model for the sales of services between 2004 and 2008 by
Please help meThe select box options are increased and decreased
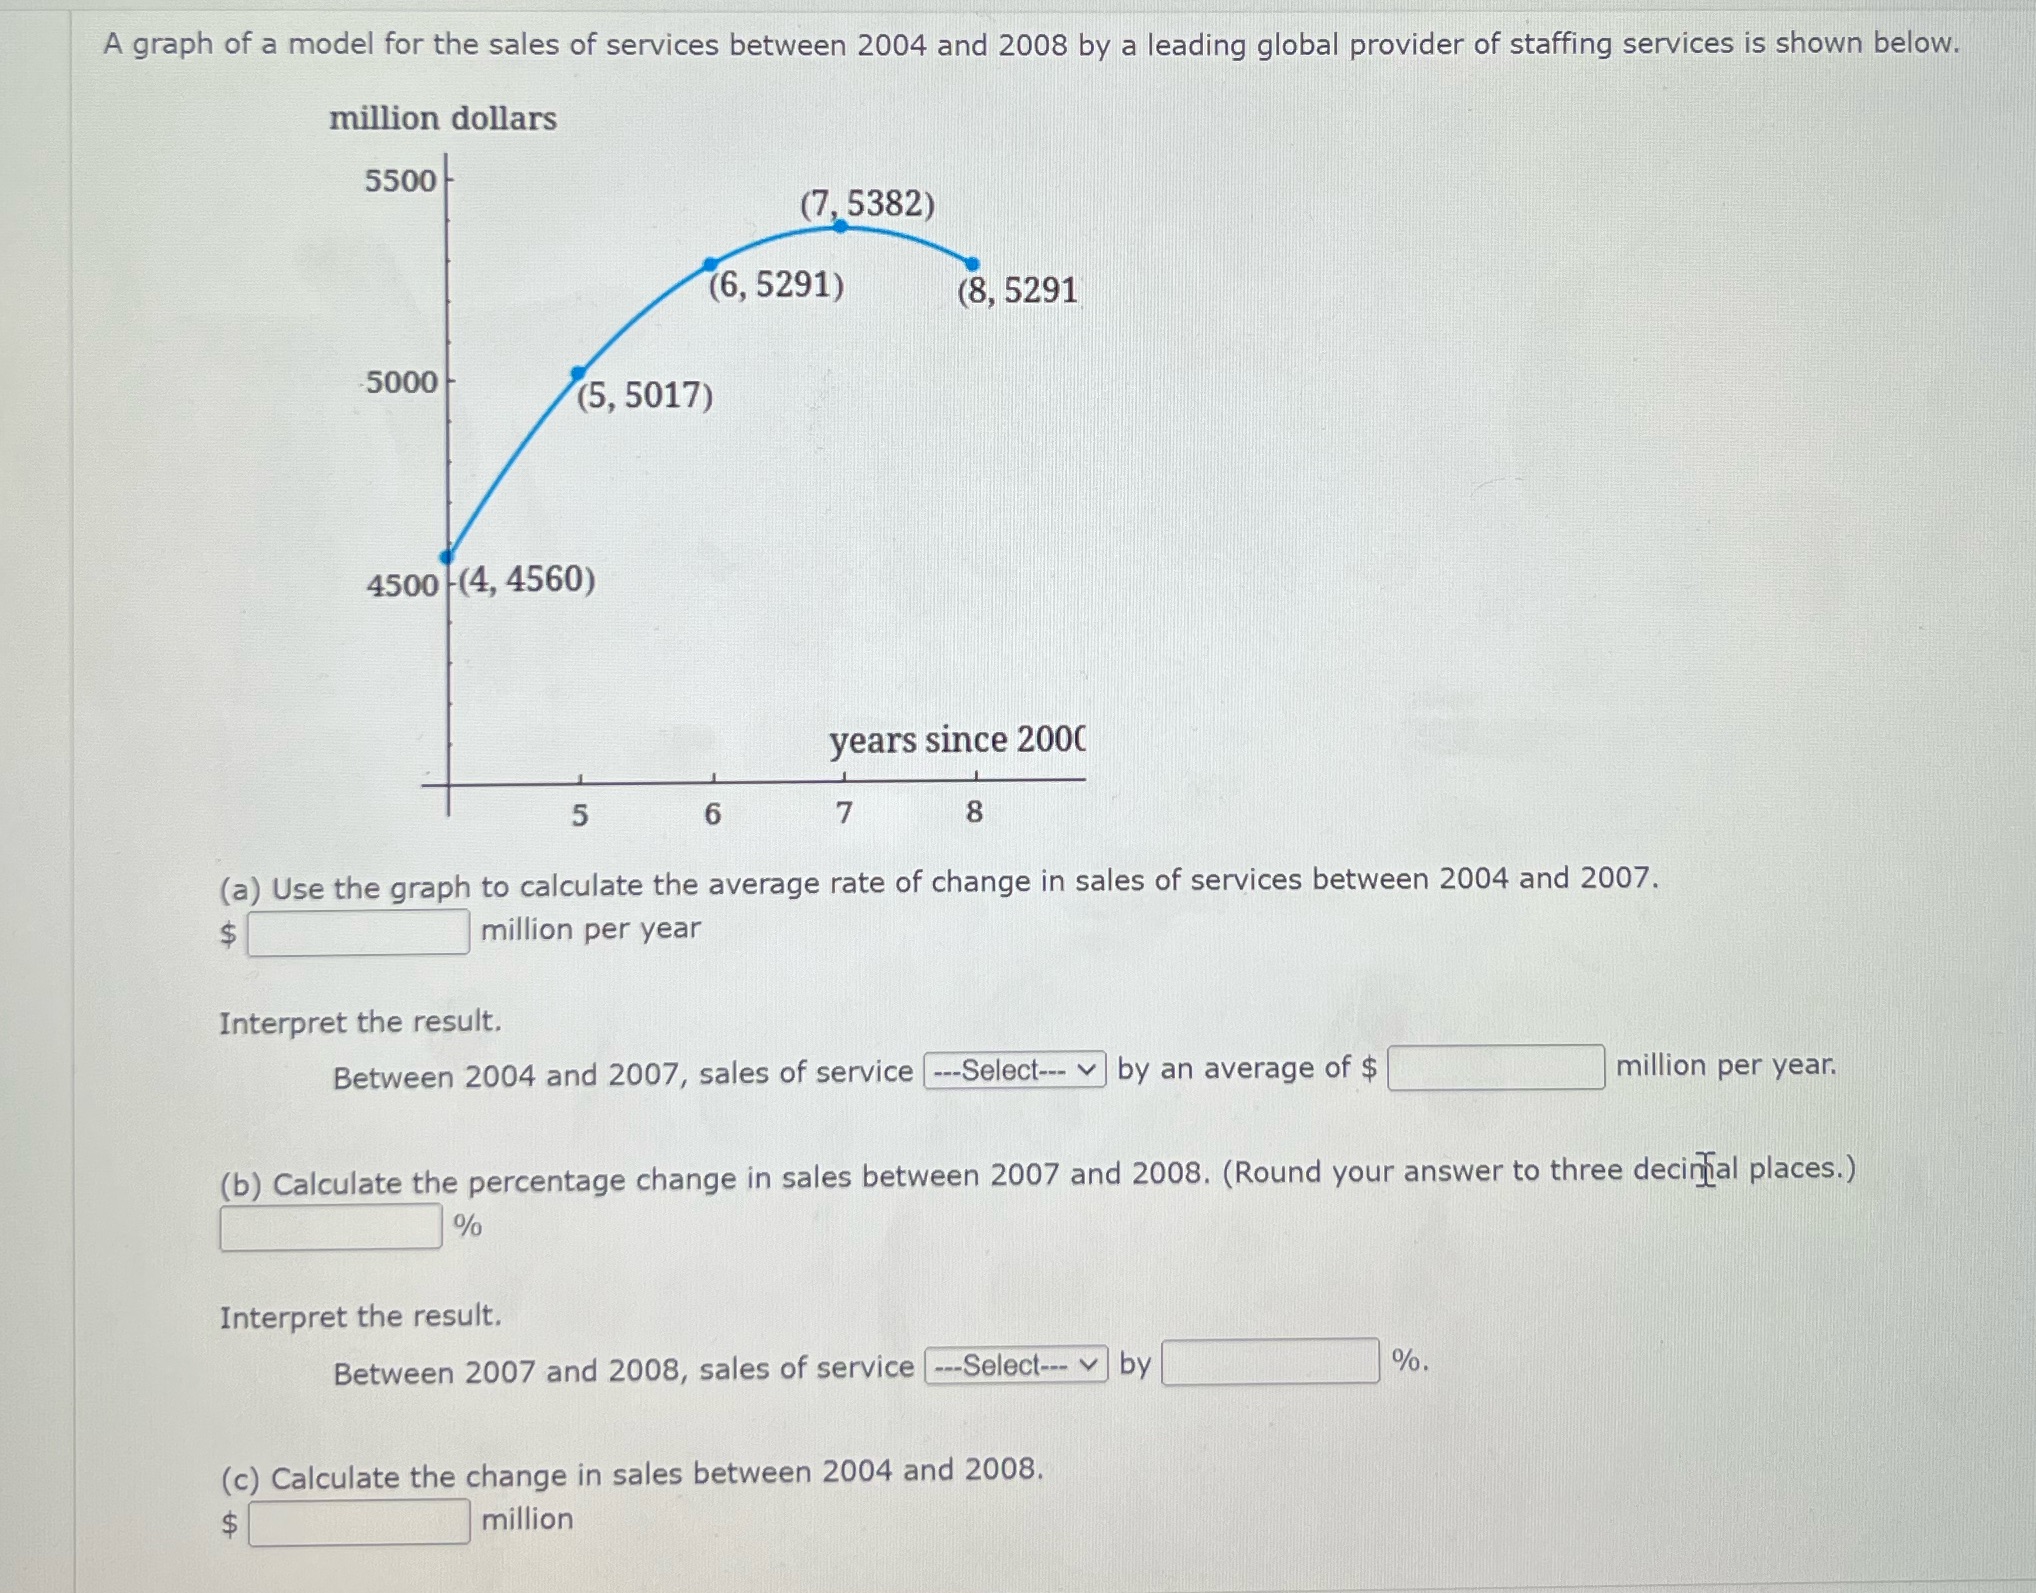
A graph of a model for the sales of services between 2004 and 2008 by a leading global provider of staffing services is shown below. million dollars 5500 (7, 5382) (6, 5291) (8, 5291 5000 (5, 5017) 4500 -(4, 4560) years since 2000 5 6 7 8 (a) Use the graph to calculate the average rate of change in sales of services between 2004 and 2007. $ million per year Interpret the result. Between 2004 and 2007, sales of service ---Select--- | by an average of $ million per year. (b) Calculate the percentage change in sales between 2007 and 2008. (Round your answer to three decimal places.) % Interpret the result. Between 2007 and 2008, sales of service [---Select--- ) by %. (c) Calculate the change in sales between 2004 and 2008. $ million
Step by Step Solution
There are 3 Steps involved in it

Get step-by-step solutions from verified subject matter experts