

Question: please help MGMT 3380: Supply Chain Mini-Case Chapter 1: Coduction Precision Engine Inc. Precision Engine purchases aluminum castings, which are formed metal parts, from suppliers
please help 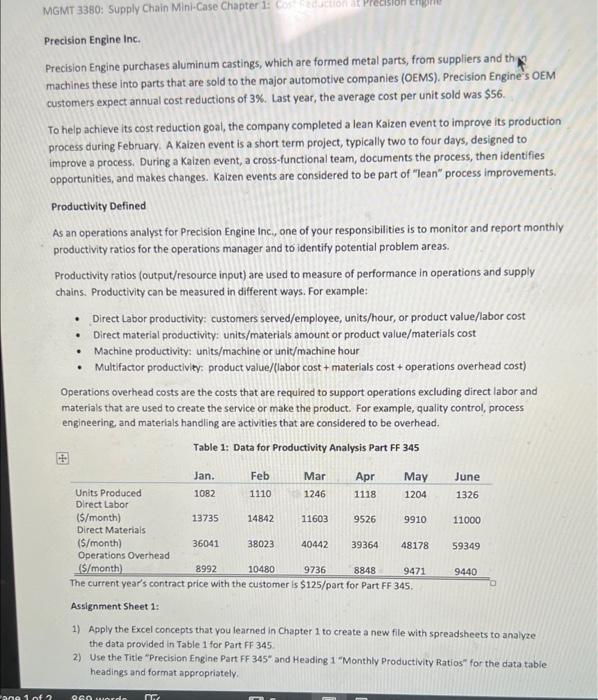
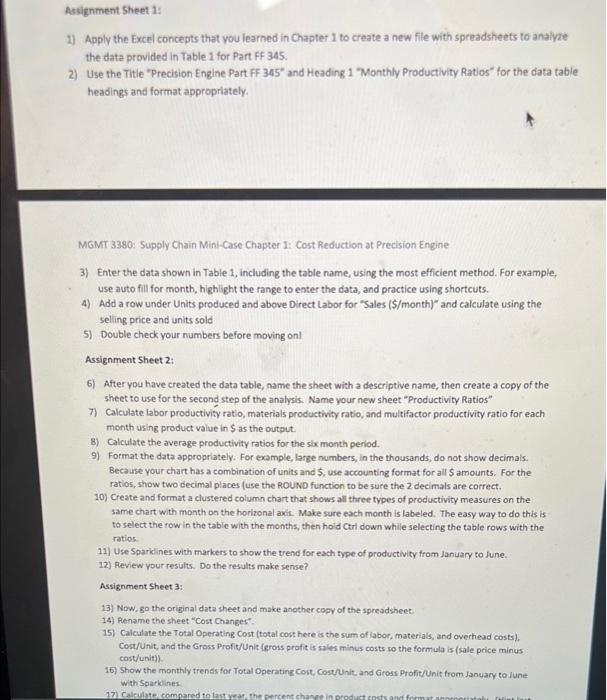
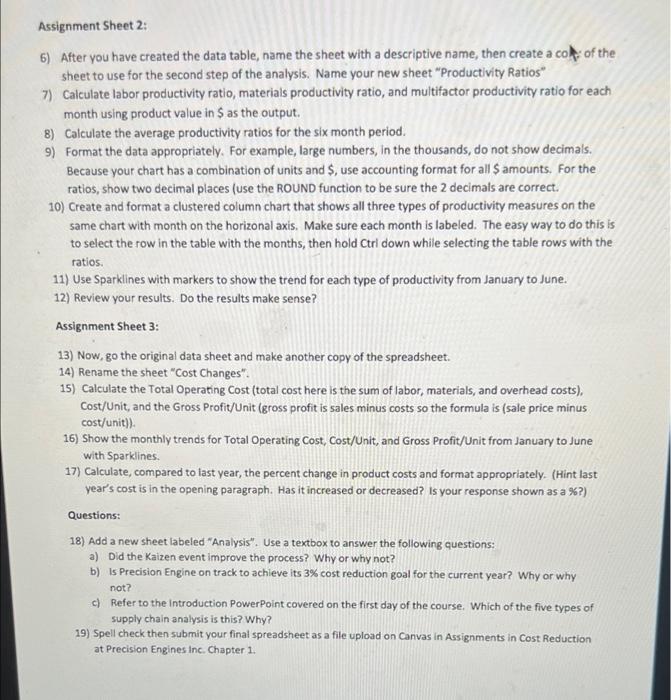
MGMT 3380: Supply Chain Mini-Case Chapter 1: Coduction Precision Engine Inc. Precision Engine purchases aluminum castings, which are formed metal parts, from suppliers and the machines these into parts that are sold to the major automotive companies (OEMS). Precision Engine's OEM customers expect annual cost reductions of 3%. Last year, the average cost per unit sold was $56. To help achieve its cost reduction goal, the company completed a lean Kaizen event to improve its production process during February. A Kalzen event is a short term project, typically two to four days, designed to improve a process. During a Kaizen event, a cross-functional team, documents the process, then identifies opportunities, and makes changes. Kaizen events are considered to be part of "lean" process improvements. Productivity Defined As an operations analyst for Precision Engine Inc., one of your responsibilities is to monitor and report monthly productivity ratios for the operations manager and to identify potential problem areas. Productivity ratios (output/resource input) are used to measure of performance in operations and supply chains. Productivity can be measured in different ways. For example: Direct Labor productivity: customers served/employee, units/hour, or product value/labor cost Direct material productivity: units/materials amount or product value/materials cost Machine productivity: units/machine or unit/machine hour Multifactor productivity, product value/(labor cost + materials cost + operations overhead cost) Operations overhead costs are the costs that are required to support operations excluding direct labor and materials that are used to create the service or make the product. For example, quality control, process engineering, and materials handling are activities that are considered to be overhead. Table 1: Data for Productivity Analysis Part FF 345 Jan. June 1326 11000 Feb Mar Apr May Units Produced 1082 1110 1246 1118 1204 Direct Labor ($/month) 13735 14842 11603 9526 9910 Direct Materials ($/month) 36041 38023 40442 39364 48178 Operations Overhead 15/month 8992 10480 9736 8848 9471 The current year's contract price with the customer is $125/part for Part FF 345. Assignment Sheet 1: 59349 9440 1) Apply the Excel concepts that you learned in Chapter 1 to create a new file with spreadsheets to analyze the data provided in Table 1 for Part FF 345 2) Use the Title "Precision Engine Part FF 345" and Heading 1 Monthly Productivity Ratios" for the data table headings and format appropriately an 1 of 2 OGowda Assignment Sheet 1: 1) Apply the Excel concepts that you learned in Chapter 1 to create a new file with spreadsheets to analyze the data provided in Table 1 for Part FF 345. 2) Use the Title "Precision Engine Part FF 345" and Heading 1 Monthly Productivity Ratios" for the data table headings and format appropriately MGMT 3380: Supply Chain Mini-Case Chapter 1: Cost Reduction at Precision Engine 3) Enter the data shown in Table 1, including the table name, using the most efficient method. For example, use auto fill for month, highlight the range to enter the data, and practice using shortcuts. 4) Add a row under Units produced and above Direct labor for "Sales ($/month)" and calculate using the selling price and units sold 5) Double check your numbers before moving on Assignment Sheet 2: 6) After you have created the data table, name the sheet with a descriptive name, then create a copy of the sheet to use for the second step of the analysis. Name your new sheet "Productivity Ratios" 7) Calculate labor productivity ratio, materials productivity ratio, and multifactor productivity ratio for each month using product value in $ as the output 8) Calculate the average productivity ratios for the six month period. 9) Format the data appropriately. For example, large numbers, in the thousands, do not show decimals. Because your chart has a combination of units and $, use accounting format for all amounts. For the ratios, show two decimal places (use the ROUND function to be sure the 2 decimals are correct. 10) Create and format a clustered column chart that shows all three types of productivity measures on the same chart with month on the horizonal axis. Make sure each month is labeled. The easy way to do this is to select the row in the table with the months, then hold Ctrl down while selecting the table rows with the ratios 11) Use Sparklines with markers to show the trend for each type of productivity from January to June. 12) Review your results. Do the results make sense? Assignment Sheet 3: 13) Now, go the original data sheet and make another copy of the spreadsheet 14) Rename the sheet"Cost Changes 15) Calculate the Total Operating Cost (total cost here's the sum of labor, materials, and overhead costs) Cost/Unit, and the Gross Profit/Unit (gross profit is sales minus costs so the formula is (sale price minus cost/unit)) 16) Show the monthly trends for Total Operating Cost Cost/Unit and Gross Profit/Unit from January to June with Sparklines 17 Cato compared to last the percent change in product costs and format annorintah Dimi Assignment Sheet 2: 6) After you have created the data table, name the sheet with a descriptive name, then create a cop of the sheet to use for the second step of the analysis. Name your new sheet "Productivity Ratios" 7) Calculate labor productivity ratio, materials productivity ratio, and multifactor productivity ratio for each month using product value in $ as the output. 8) Calculate the average productivity ratios for the six month period. 9) Format the data appropriately. For example, large numbers, in the thousands, do not show decimals. Because your chart has a combination of units and $, use accounting format for all Samounts. For the ratios, show two decimal places (use the ROUND function to be sure the 2 decimals are correct. 10) Create and format a clustered column chart that shows all three types of productivity measures on the same chart with month on the horizonal axis. Make sure each month is labeled. The easy way to do this is to select the row in the table with the months, then hold Ctrl down while selecting the table rows with the ratios 11) Use Sparklines with markers to show the trend for each type of productivity from January to June. 12) Review your results. Do the results make sense? Assignment Sheet 3: 13) Now, go the original data sheet and make another copy of the spreadsheet. 14) Rename the sheet "Cost Changes". 15) Calculate the Total Operating Cost (total cost here is the sum of labor, materials, and overhead costs), Cost/Unit, and the Gross Profit/Unit (gross profit is sales minus costs so the formula is (sale price minus cost/unit)) 16) Show the monthly trends for Total Operating cost, Cost/Unit, and Gross Profit/Unit from January to June with Sparklines. 17) Calculate, compared to last year, the percent change in product costs and format appropriately. (Hint last year's cost is in the opening paragraph. Has it increased or decreased? Is your response shown as a %?) Questions: 18) Add a new sheet labeled "Analysis". Use a textbox to answer the following questions: a) Did the Kaizen event improve the process? Why or why not? b) Is Precision Engine on track to achieve its 3% cost reduction goal for the current year? Why or why not? c) Refer to the introduction PowerPoint covered on the first day of the course. Which of the five types of supply chain analysis is this? Why? 19) Spell check then submit your final spreadsheet as a file upload on Canvas in Assignments in Cost Reduction at Precision Engines Inc. Chapter 1. MGMT 3380: Supply Chain Mini-Case Chapter 1: Coduction Precision Engine Inc. Precision Engine purchases aluminum castings, which are formed metal parts, from suppliers and the machines these into parts that are sold to the major automotive companies (OEMS). Precision Engine's OEM customers expect annual cost reductions of 3%. Last year, the average cost per unit sold was $56. To help achieve its cost reduction goal, the company completed a lean Kaizen event to improve its production process during February. A Kalzen event is a short term project, typically two to four days, designed to improve a process. During a Kaizen event, a cross-functional team, documents the process, then identifies opportunities, and makes changes. Kaizen events are considered to be part of "lean" process improvements. Productivity Defined As an operations analyst for Precision Engine Inc., one of your responsibilities is to monitor and report monthly productivity ratios for the operations manager and to identify potential problem areas. Productivity ratios (output/resource input) are used to measure of performance in operations and supply chains. Productivity can be measured in different ways. For example: Direct Labor productivity: customers served/employee, units/hour, or product value/labor cost Direct material productivity: units/materials amount or product value/materials cost Machine productivity: units/machine or unit/machine hour Multifactor productivity, product value/(labor cost + materials cost + operations overhead cost) Operations overhead costs are the costs that are required to support operations excluding direct labor and materials that are used to create the service or make the product. For example, quality control, process engineering, and materials handling are activities that are considered to be overhead. Table 1: Data for Productivity Analysis Part FF 345 Jan. June 1326 11000 Feb Mar Apr May Units Produced 1082 1110 1246 1118 1204 Direct Labor ($/month) 13735 14842 11603 9526 9910 Direct Materials ($/month) 36041 38023 40442 39364 48178 Operations Overhead 15/month 8992 10480 9736 8848 9471 The current year's contract price with the customer is $125/part for Part FF 345. Assignment Sheet 1: 59349 9440 1) Apply the Excel concepts that you learned in Chapter 1 to create a new file with spreadsheets to analyze the data provided in Table 1 for Part FF 345 2) Use the Title "Precision Engine Part FF 345" and Heading 1 Monthly Productivity Ratios" for the data table headings and format appropriately an 1 of 2 OGowda Assignment Sheet 1: 1) Apply the Excel concepts that you learned in Chapter 1 to create a new file with spreadsheets to analyze the data provided in Table 1 for Part FF 345. 2) Use the Title "Precision Engine Part FF 345" and Heading 1 Monthly Productivity Ratios" for the data table headings and format appropriately MGMT 3380: Supply Chain Mini-Case Chapter 1: Cost Reduction at Precision Engine 3) Enter the data shown in Table 1, including the table name, using the most efficient method. For example, use auto fill for month, highlight the range to enter the data, and practice using shortcuts. 4) Add a row under Units produced and above Direct labor for "Sales ($/month)" and calculate using the selling price and units sold 5) Double check your numbers before moving on Assignment Sheet 2: 6) After you have created the data table, name the sheet with a descriptive name, then create a copy of the sheet to use for the second step of the analysis. Name your new sheet "Productivity Ratios" 7) Calculate labor productivity ratio, materials productivity ratio, and multifactor productivity ratio for each month using product value in $ as the output 8) Calculate the average productivity ratios for the six month period. 9) Format the data appropriately. For example, large numbers, in the thousands, do not show decimals. Because your chart has a combination of units and $, use accounting format for all amounts. For the ratios, show two decimal places (use the ROUND function to be sure the 2 decimals are correct. 10) Create and format a clustered column chart that shows all three types of productivity measures on the same chart with month on the horizonal axis. Make sure each month is labeled. The easy way to do this is to select the row in the table with the months, then hold Ctrl down while selecting the table rows with the ratios 11) Use Sparklines with markers to show the trend for each type of productivity from January to June. 12) Review your results. Do the results make sense? Assignment Sheet 3: 13) Now, go the original data sheet and make another copy of the spreadsheet 14) Rename the sheet"Cost Changes 15) Calculate the Total Operating Cost (total cost here's the sum of labor, materials, and overhead costs) Cost/Unit, and the Gross Profit/Unit (gross profit is sales minus costs so the formula is (sale price minus cost/unit)) 16) Show the monthly trends for Total Operating Cost Cost/Unit and Gross Profit/Unit from January to June with Sparklines 17 Cato compared to last the percent change in product costs and format annorintah Dimi Assignment Sheet 2: 6) After you have created the data table, name the sheet with a descriptive name, then create a cop of the sheet to use for the second step of the analysis. Name your new sheet "Productivity Ratios" 7) Calculate labor productivity ratio, materials productivity ratio, and multifactor productivity ratio for each month using product value in $ as the output. 8) Calculate the average productivity ratios for the six month period. 9) Format the data appropriately. For example, large numbers, in the thousands, do not show decimals. Because your chart has a combination of units and $, use accounting format for all Samounts. For the ratios, show two decimal places (use the ROUND function to be sure the 2 decimals are correct. 10) Create and format a clustered column chart that shows all three types of productivity measures on the same chart with month on the horizonal axis. Make sure each month is labeled. The easy way to do this is to select the row in the table with the months, then hold Ctrl down while selecting the table rows with the ratios 11) Use Sparklines with markers to show the trend for each type of productivity from January to June. 12) Review your results. Do the results make sense? Assignment Sheet 3: 13) Now, go the original data sheet and make another copy of the spreadsheet. 14) Rename the sheet "Cost Changes". 15) Calculate the Total Operating Cost (total cost here is the sum of labor, materials, and overhead costs), Cost/Unit, and the Gross Profit/Unit (gross profit is sales minus costs so the formula is (sale price minus cost/unit)) 16) Show the monthly trends for Total Operating cost, Cost/Unit, and Gross Profit/Unit from January to June with Sparklines. 17) Calculate, compared to last year, the percent change in product costs and format appropriately. (Hint last year's cost is in the opening paragraph. Has it increased or decreased? Is your response shown as a %?) Questions: 18) Add a new sheet labeled "Analysis". Use a textbox to answer the following questions: a) Did the Kaizen event improve the process? Why or why not? b) Is Precision Engine on track to achieve its 3% cost reduction goal for the current year? Why or why not? c) Refer to the introduction PowerPoint covered on the first day of the course. Which of the five types of supply chain analysis is this? Why? 19) Spell check then submit your final spreadsheet as a file upload on Canvas in Assignments in Cost Reduction at Precision Engines Inc. Chapter 1 Step by Step Solution
There are 3 Steps involved in it
1 Expert Approved Answer
Step: 1 Unlock

Question Has Been Solved by an Expert!
Get step-by-step solutions from verified subject matter experts
Step: 2 Unlock
Step: 3 Unlock