

Question: please help my data view example that helps you solve my problem vork: Chapter 14 Homework Save Score: 0 of 1 pt 5 of 7
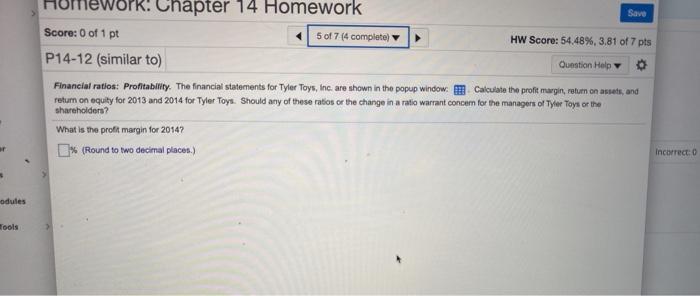
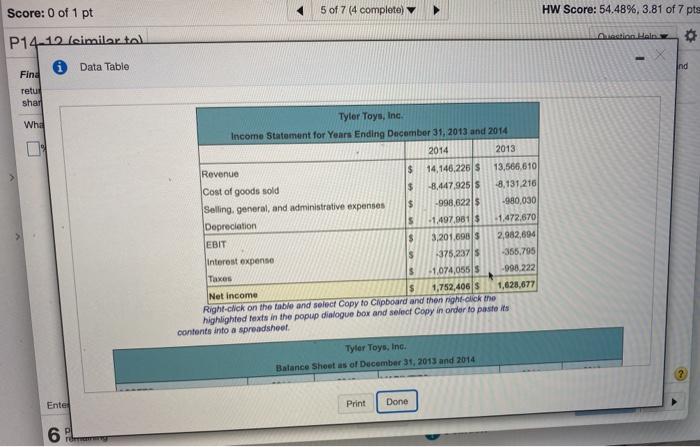
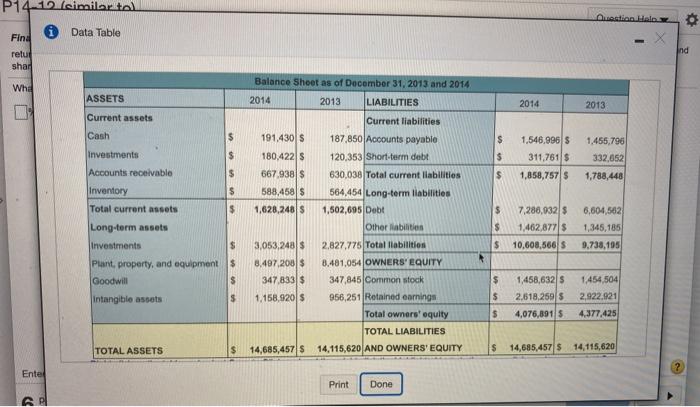
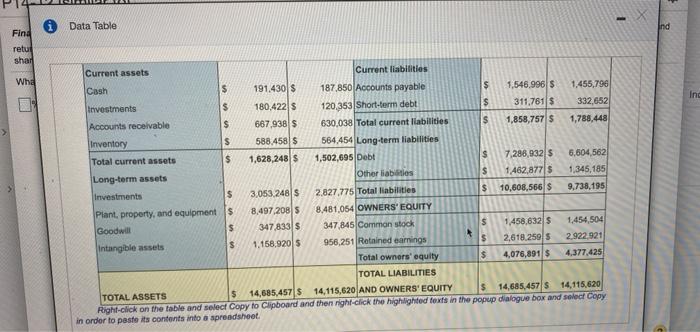
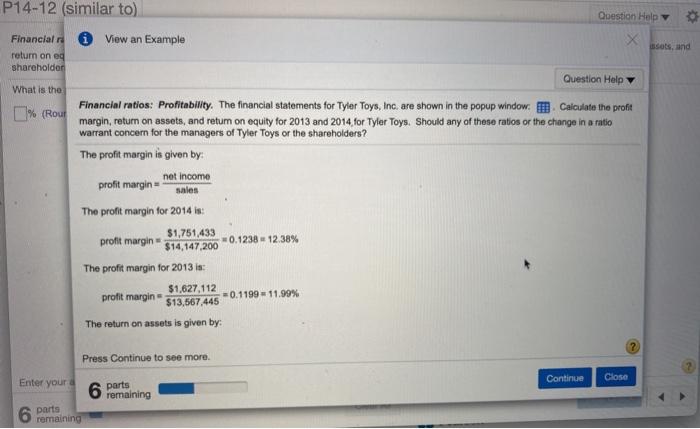
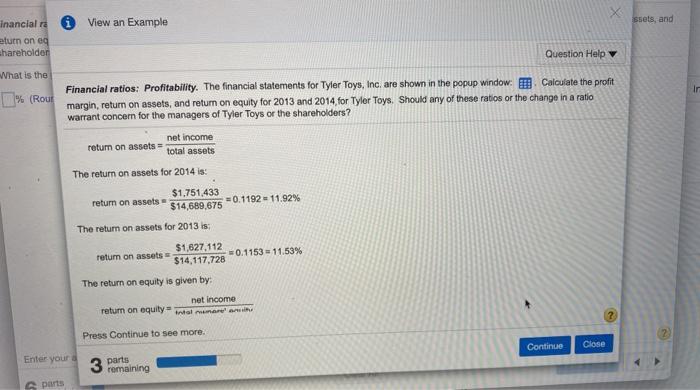
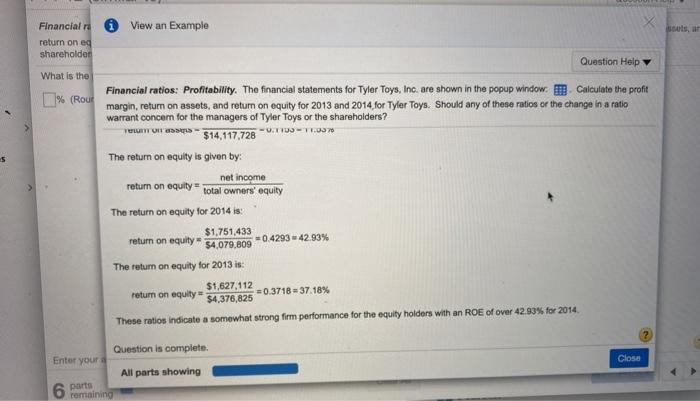
vork: Chapter 14 Homework Save Score: 0 of 1 pt 5 of 7 (4 complete) HW Score: 54.48%, 3.81 of 7 pts P14-12 (similar to) Ouestion Help Financial ratios: Profitability. The financial statements for Tyler Toys, Inc. are shown in the popup window. Calculate the profit margin, return on assets, and return on equity for 2013 and 2014 for Tyler Toys. Should any of these ratios or the change in a ratio warrant concem for the managers of Tyler Toys or the shareholders? What is the profit margin for 2014? % (Round to two decimal places.) incorrecto odules Tools Score: 0 of 1 pt 5 of 7 (4 complete) HW Score: 54.48%, 3.81 of 7 pts Quinetian Hal P14-10 leimilar tal - Data Table Ind Find retul shar Wha Tyler Toys, Inc. Income Statement for Years Ending December 31, 2013 and 2014 2014 2013 Revenue $ 14,146,226 S 13,566.610 Cost of goods sold $ -8.4479255 -8.131.210 Selling general, and administrative expenses $ -998,62215 -980,030 Depreciation 5 -1.497.981$ -1.472.670 EBIT $ 3,201.690 S 2,982,694 interest expense 375,23715 -355.795 Taxes $ -1,074,055 5 -998.222 Net Income $ 1,752,406 $ 1,628,677 Right click on the table and select Copy to clipboard and then night click the highlighted texts in the popup dialogue box and select Copy in order to pasteis contents into a spreadsheet Tyler Toys, Inc. Balance Sheet as of December 31, 2013 and 2014 Enter Print Done 6 6 TOTT P14-17 (eimilor tal i Data Table Find Question Help nd relu shar Whe Balance Sheet as of December 31, 2013 and 2014 2014 2013 LIABILITIES ASSETS 2014 2013 Current assets $ 1.455,796 332,6521 $ 191.430 180,422 667.938 $ 588,450 $ 1,628,248 S 1,546,996 $ 311,761 $ 1,858,757 $ $ 1,788,448 $ Cash $ Investments $ Accounts receivable $ Inventory $ Total current assets $ Long-term assets Investments $ Plant, property, and equipments Goodwill $ Intangible assets s 7,288,032 $ 1,462,877 $ $ Current liabilities 187,850 Accounts payable 120,353 Short-term debt 630,038 Total current liabilities 564,454 Long-term liabilities 1,502,695 Debt Other liabilities 2,827,775 Total liabilities 8.481,054 OWNERS' EQUITY 347,845 Common stock 956,251 Retained earnings Total owners' equity TOTAL LIABILITIES 14,115,620 AND OWNERS' EQUITY 6,604,562 1,345,185 9,738,195 3,053,243 $ 10,608,566 8.497,200 $ 347,833$ $ 1.158.920 $ $ 1,458,632 S 2,618,259 $ 4,076,891 1,454,504 2,922.921 4.377,425 $ TOTAL ASSETS $ 14,685,457 $ $ 14,685,457 $ 14,115,620 Ente Print Done PU X 1 * Data Table nd Find retu shar Whe Inc Current assets Current liabilities Cash 191.430$ 187,850 Accounts payable $ 1,546,996 $ 1.455,796 Investments $ 180,422 $ 120 353 Short-term debt $ 311,761 S 332,652 Accounts receivable $ 667,938$ 630,038 Total current liabilities $ 1,858,757 1,788,448 Inventory $ 588.458 $ 564,454 Long-term liabilities Total current assets $ 1,628,248 $ 1,502,695 Debt $ 7,286,93215 6,604,562 Long-term assets Other liabtios $ 1,462,877 $ 1,345,185 Investments $ 3.053 248 $ 2.827.775 Total liabilities $ 10,608,566 $ 9,738,195 Plant property, and equipments 8,497,208) 8,481,054 OWNERS' EQUITY Goodwill $ 347,833$ 347,845 Common stock $ 1,458,6325 1,454,504 Intangible assets $ 1.158.92015 956,251 Retnined earnings $ 2,618.250 $ 2.922,921 Total owners' equity $ 4,076,891 $ 4.377,425 TOTAL LIABILITIES TOTAL ASSETS 5 14,685,457 $ 14,115,620 AND OWNERS' EQUITY $ 14,685,457 14, 115,620 Right click on the table and select Copy to clipboard and then right click the highlighted texts in the popup dialogue box and select Copy in order to paste its contents into a spreadsheet P14-12 (similar to) Question Help 0 View an Example X issots, and Financial return on eg shareholder What is the [% (Rout Question Help Financial ratios: Profitability. The financial statements for Tyler Toys, Inc. are shown in the popup window. 7. Calculate the profit margin, return on assets, and retum on equity for 2013 and 2014 for Tyler Toys. Should any of these ratios or the change in a ratio warrant concern for the managers of Tyler Toys or the shareholders? The profit margin is given by: profit margin- net income sales The profit margin for 2014 is: $1,751,433 profit margin- 0.1238 12.38% $14,147,200 The profit margin for 2013 is: $1,627,112 profit margin- = 0.1199 11,99% $13,567,445 The return on assets is given by: Press Continue to see more. Continue Close Enter your 6 parts remaining 6 parts remaining X View an Example sets, and inancial eturn on eg hareholder Question Help What is the ir 1% (ROU Financial ratios: Profitability. The financial statements for Tyler Toys, Inc. are shown in the popup window. Calculate the profit margin, return on assets, and return on equity for 2013 and 2014, for Tyler Toys. Should any of these ratios or the change in a ratio warrant concern for the managers of Tyler Toys or the shareholders? net income return on assets = total assets The return on assets for 2014 is: $1.751,433 return on assets = 0.1192 = 11.92% $14,689.675 The return on assets for 2013 is: $1,627,112 return on assets +0.1153 - 11.53% $14,117,728 The return on equity is given by net income return on equity tal Press Continue to see more. Continue Close Enter your 3 parts remaining parts View an Example X Financial return on eg shareholder What is the % (Rou 5 Question Help Financial ratios: Profitability. The financial statements for Tyler Toys, Inc. are shown in the popup window. I Calculate the profit margin, return on assets, and return on equity for 2013 and 2014 for Tyler Toys. Should any of these ratios or the change in a ratio warrant concern for the managers of Tyler Toys or the shareholders? YLON $14,117,728 -0.1. The return on equity is given by: net income return on equity total owners' equity The return on equity for 2014 is: $1,751,433 return on equity $4,079,809 =0.429342.93% The return on equity for 2013 is: $1,627,112 return on equity = = 0.3718 = 37.18% $4,376,825 These ratios indicate a somewhat strong firm performance for the equity holders with an ROE of over 42.93% for 2014 Question is complete. Enter your Close All parts showing 6 parto remaining
Step by Step Solution
There are 3 Steps involved in it

Get step-by-step solutions from verified subject matter experts