

Question: please help! need work show in excel! will leave feedback! A B 1 D E F G 3 2 The defect rate (central line) for
please help! need work show in excel! will leave feedback! 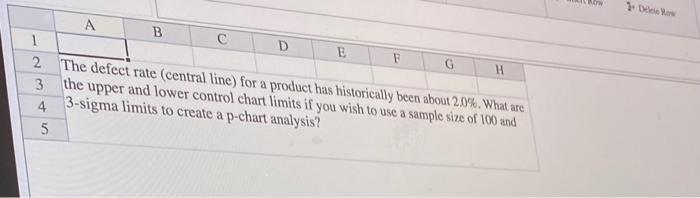
A B 1 D E F G 3 2 The defect rate (central line) for a product has historically been about 20%. What are the upper and lower control chart limits if you wish to use a sample size of 100 and 4. 3-sigma limits to create a p-chart analysis? 5 Step by Step Solution
There are 3 Steps involved in it
1 Expert Approved Answer
Step: 1 Unlock

Question Has Been Solved by an Expert!
Get step-by-step solutions from verified subject matter experts
Step: 2 Unlock
Step: 3 Unlock