

Question: please help, please make all the number visible when you adjusting format of paper. Break-Even Sales and Cost-Volume-Profit Chart For the coming year. Cleves Company
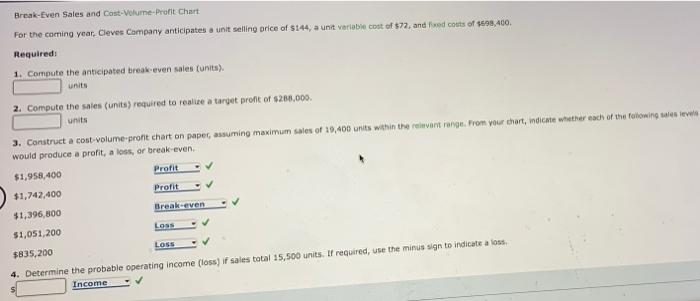
Break-Even Sales and Cost-Volume-Profit Chart For the coming year. Cleves Company anticipates a unit selling price of $144, a unit variable cost of $72, and we couts of $898,400 Required: 1. Compute the anticipated break even soles units) units 2. Compute the sales (units) required to realice a target profit of $200,000 units 3. Construct a cost-volume-profit chart on paper, assuming maximum sales of 19,400 units within the relevant range from your chart, indicate whether each of the following would produce a profit, a loss, or break even $1,958.400 Profit $1,742,400 Profit $1,396,800 Break-even $1,051,200 LOSS $835,200 LOSS 4. Determine the probable operating income (los) if sales total 15,500 units. If required, use the minus sign to indicate a loss Income
Step by Step Solution
There are 3 Steps involved in it

Get step-by-step solutions from verified subject matter experts