

Question: please help, please make all the number visible when you adjusting format of paper. Contribution Margin, Break-Even Sales, Cost VolumeProhit Chart, Margin of safety, and
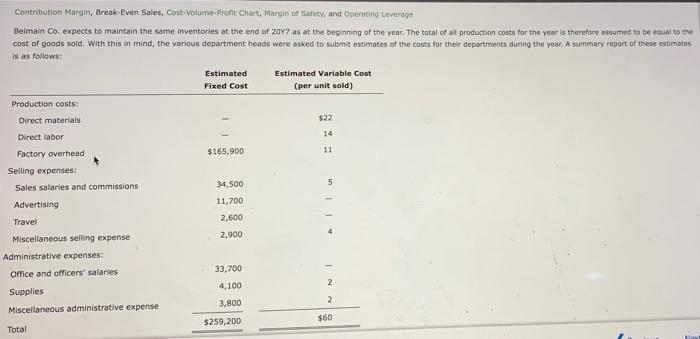
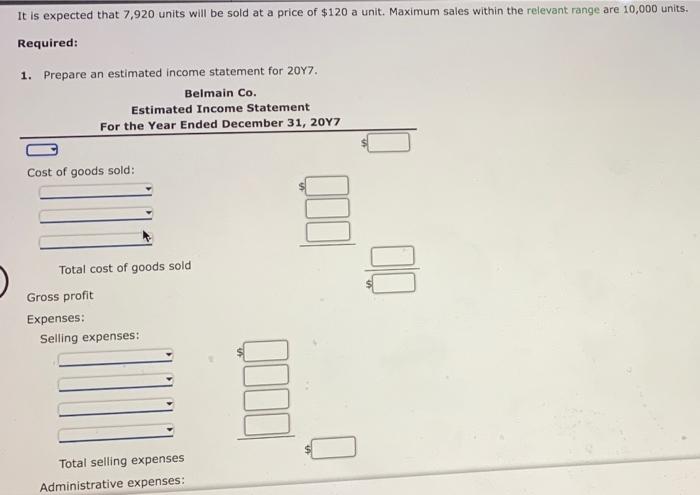
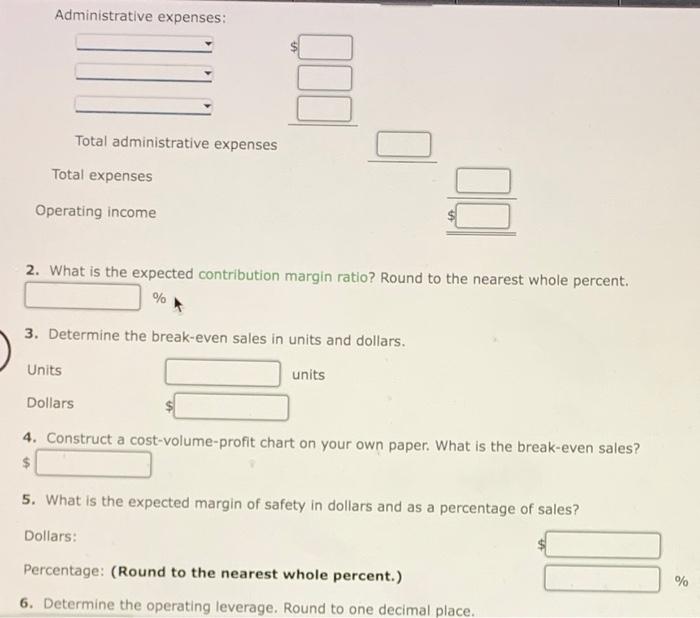
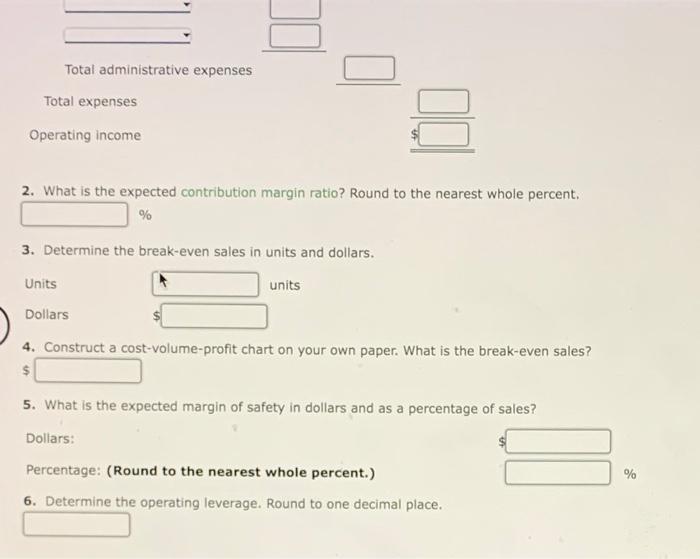
Contribution Margin, Break-Even Sales, Cost VolumeProhit Chart, Margin of safety, and Operating Leverage 14 11 Belmain Co. expects to maintain the same inventories at the end of 2017 as at the beginning of the year. The total of all production costs for the year is therefore assumed to be equal to the cost of goods sold. With this in mind, the vanous department heads were asked to submit estimates of the costs for their departments during the year. A summary report of these estimates is as follows: Estimated Estimated Variable Cost Fixed Cost (per unit sold) Production costs: Direct materials $22 Direct labor Factory overhead $165,900 Selling expenses: Sales salaries and commissions 34,500 5 Advertising 11,700 Travel 2,600 Miscellaneous selling expense 2,900 Administrative expenses: Office and officers' salaries 33,700 4,100 2 Supplies 3,800 Miscellaneous administrative expense $259,200 $60 Total NN It is expected that 7,920 units will be sold at a price of $120 a unit. Maximum sales within the relevant range are 10,000 units. Required: 1. Prepare an estimated income statement for 2017. Belmain Co. Estimated Income Statement For the Year Ended December 31, 2017 Cost of goods sold: Total cost of goods sold Gross profit Expenses: Selling expenses: Total selling expenses Administrative expenses: Administrative expenses: Total administrative expenses Total expenses Operating income 2. What is the expected contribution margin ratio? Round to the nearest whole percent. % 3. Determine the break-even sales in units and dollars. Units units Dollars 4. Construct a cost-volume-profit chart on your own paper. What is the break-even sales? $ 5. What is the expected margin of safety in dollars and as a percentage of sales? Dollars: Percentage: (Round to the nearest whole percent.) % 6. Determine the operating leverage. Round to one decimal place. Total administrative expenses Total expenses Operating income 2. What is the expected contribution margin ratio? Round to the nearest whole percent. % 3. Determine the break-even sales in units and dollars. Units units Dollars 4. Construct a cost-volume-profit chart on your own paper. What is the break-even sales? $ 5. What is the expected margin of safety in dollars and as a percentage of sales? Dollars: % Percentage: (Round to the nearest whole percent.) 6. Determine the operating leverage. Round to one decimal place
Step by Step Solution
There are 3 Steps involved in it

Get step-by-step solutions from verified subject matter experts