

Question: Please help Question 1 Data for Hooser Designs, Inc. follow: @ (Click the icon to view the data.) Data table Read the uirements. Hooser Designs,
Please help
Question 1
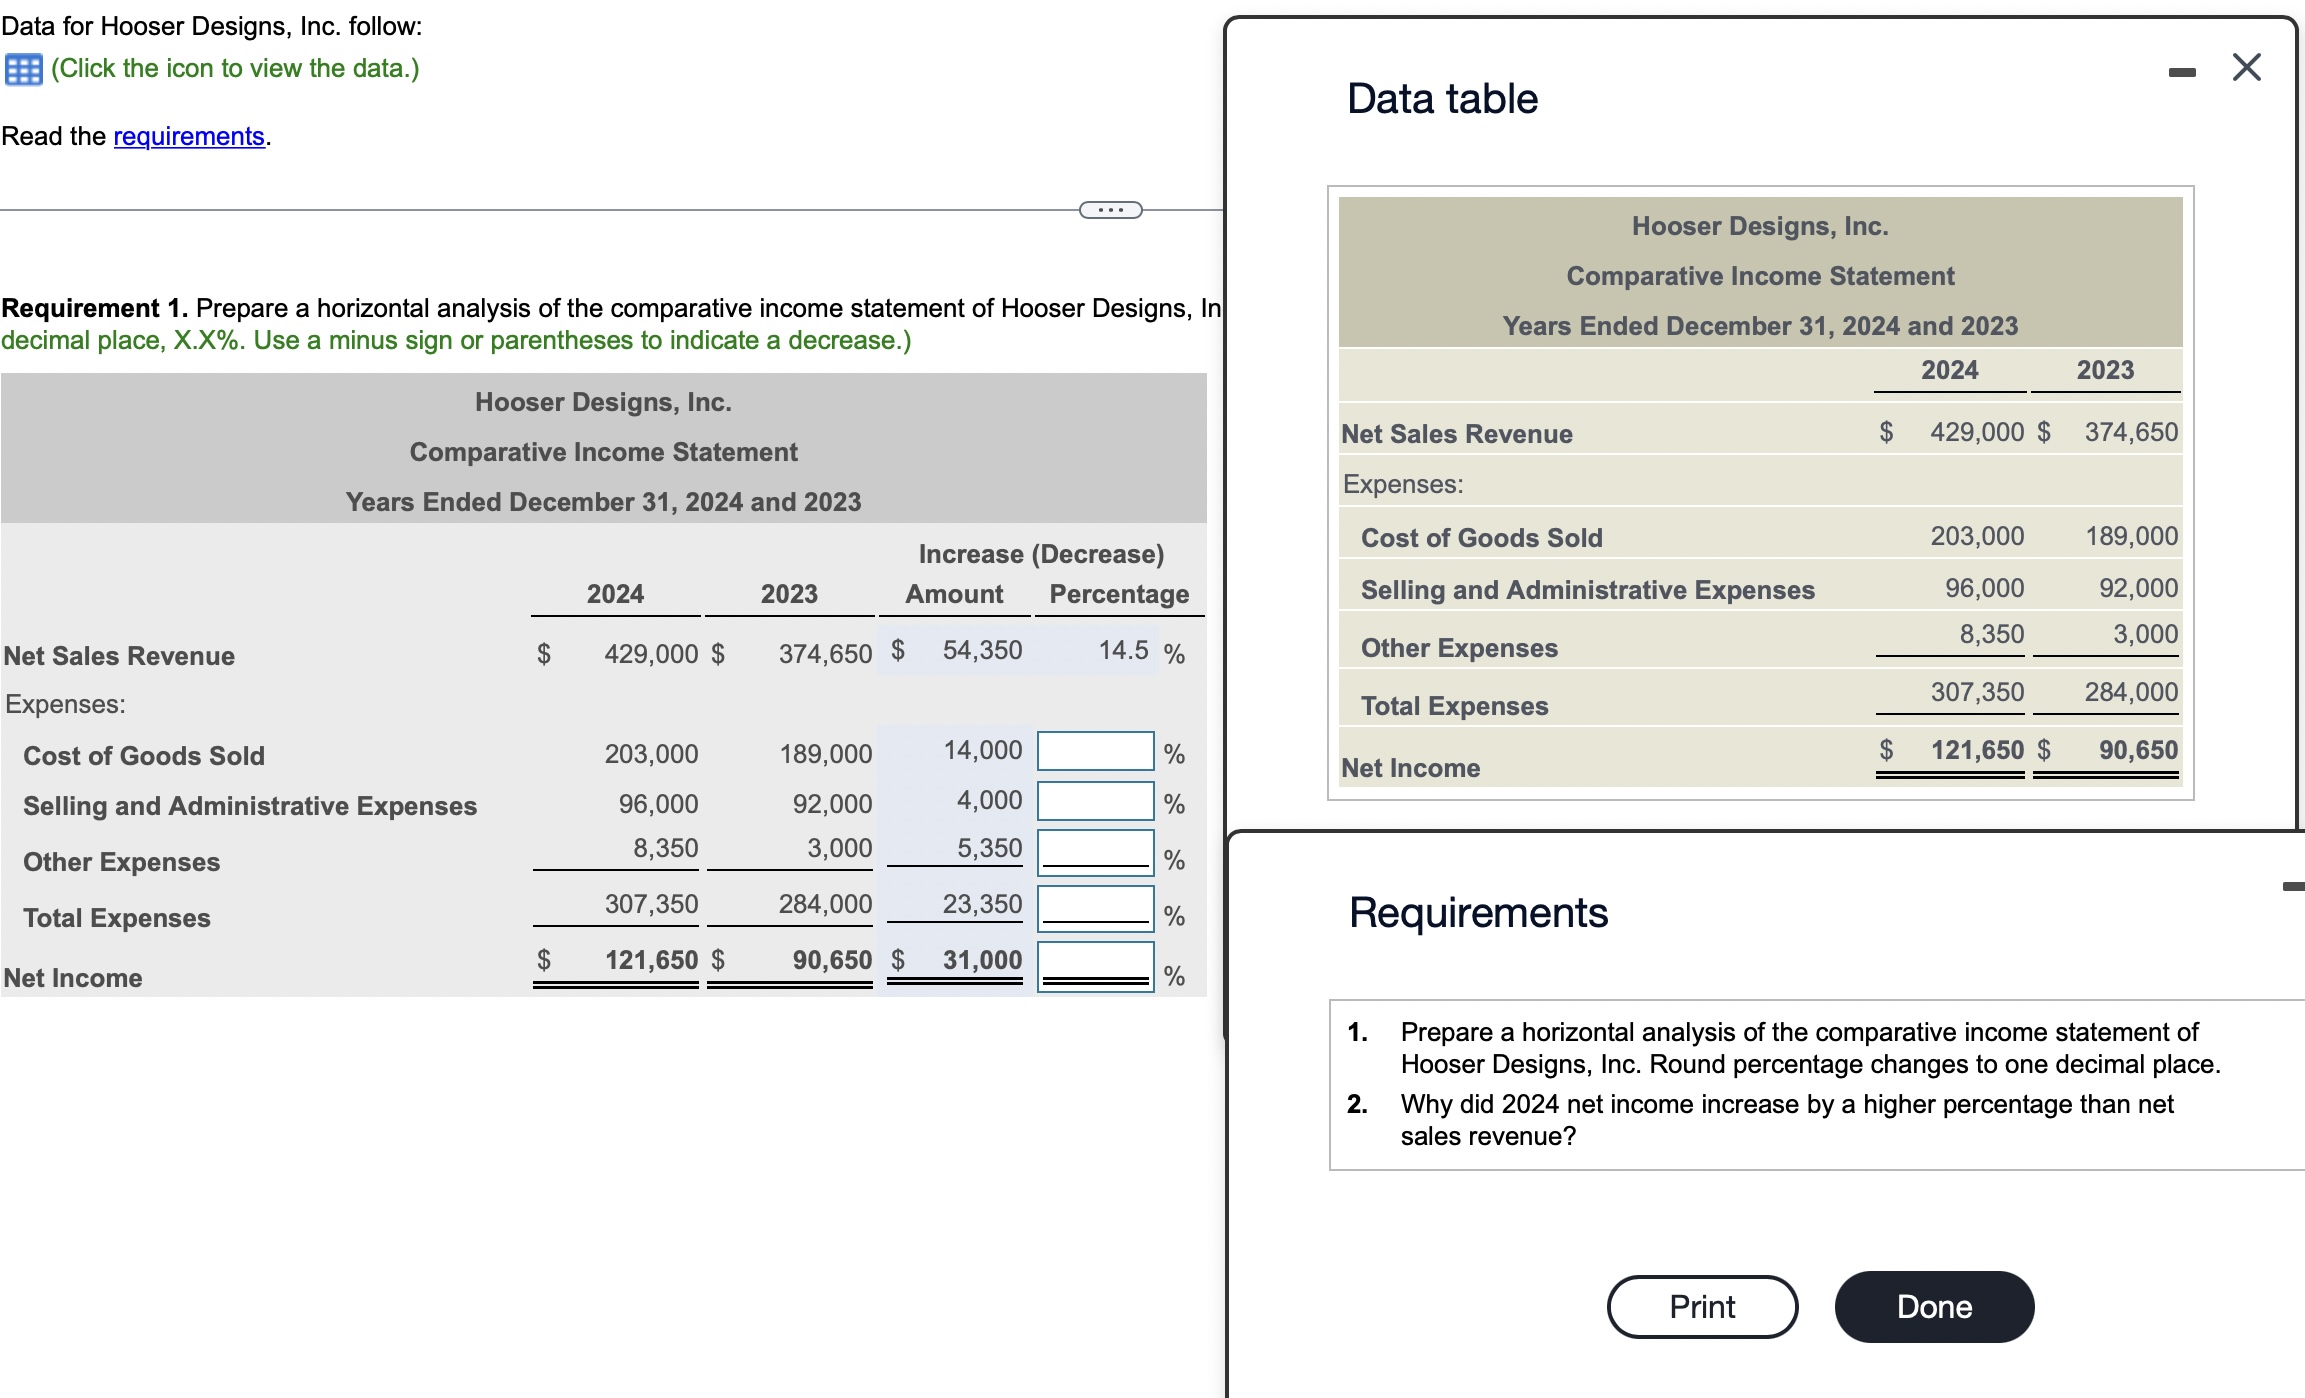
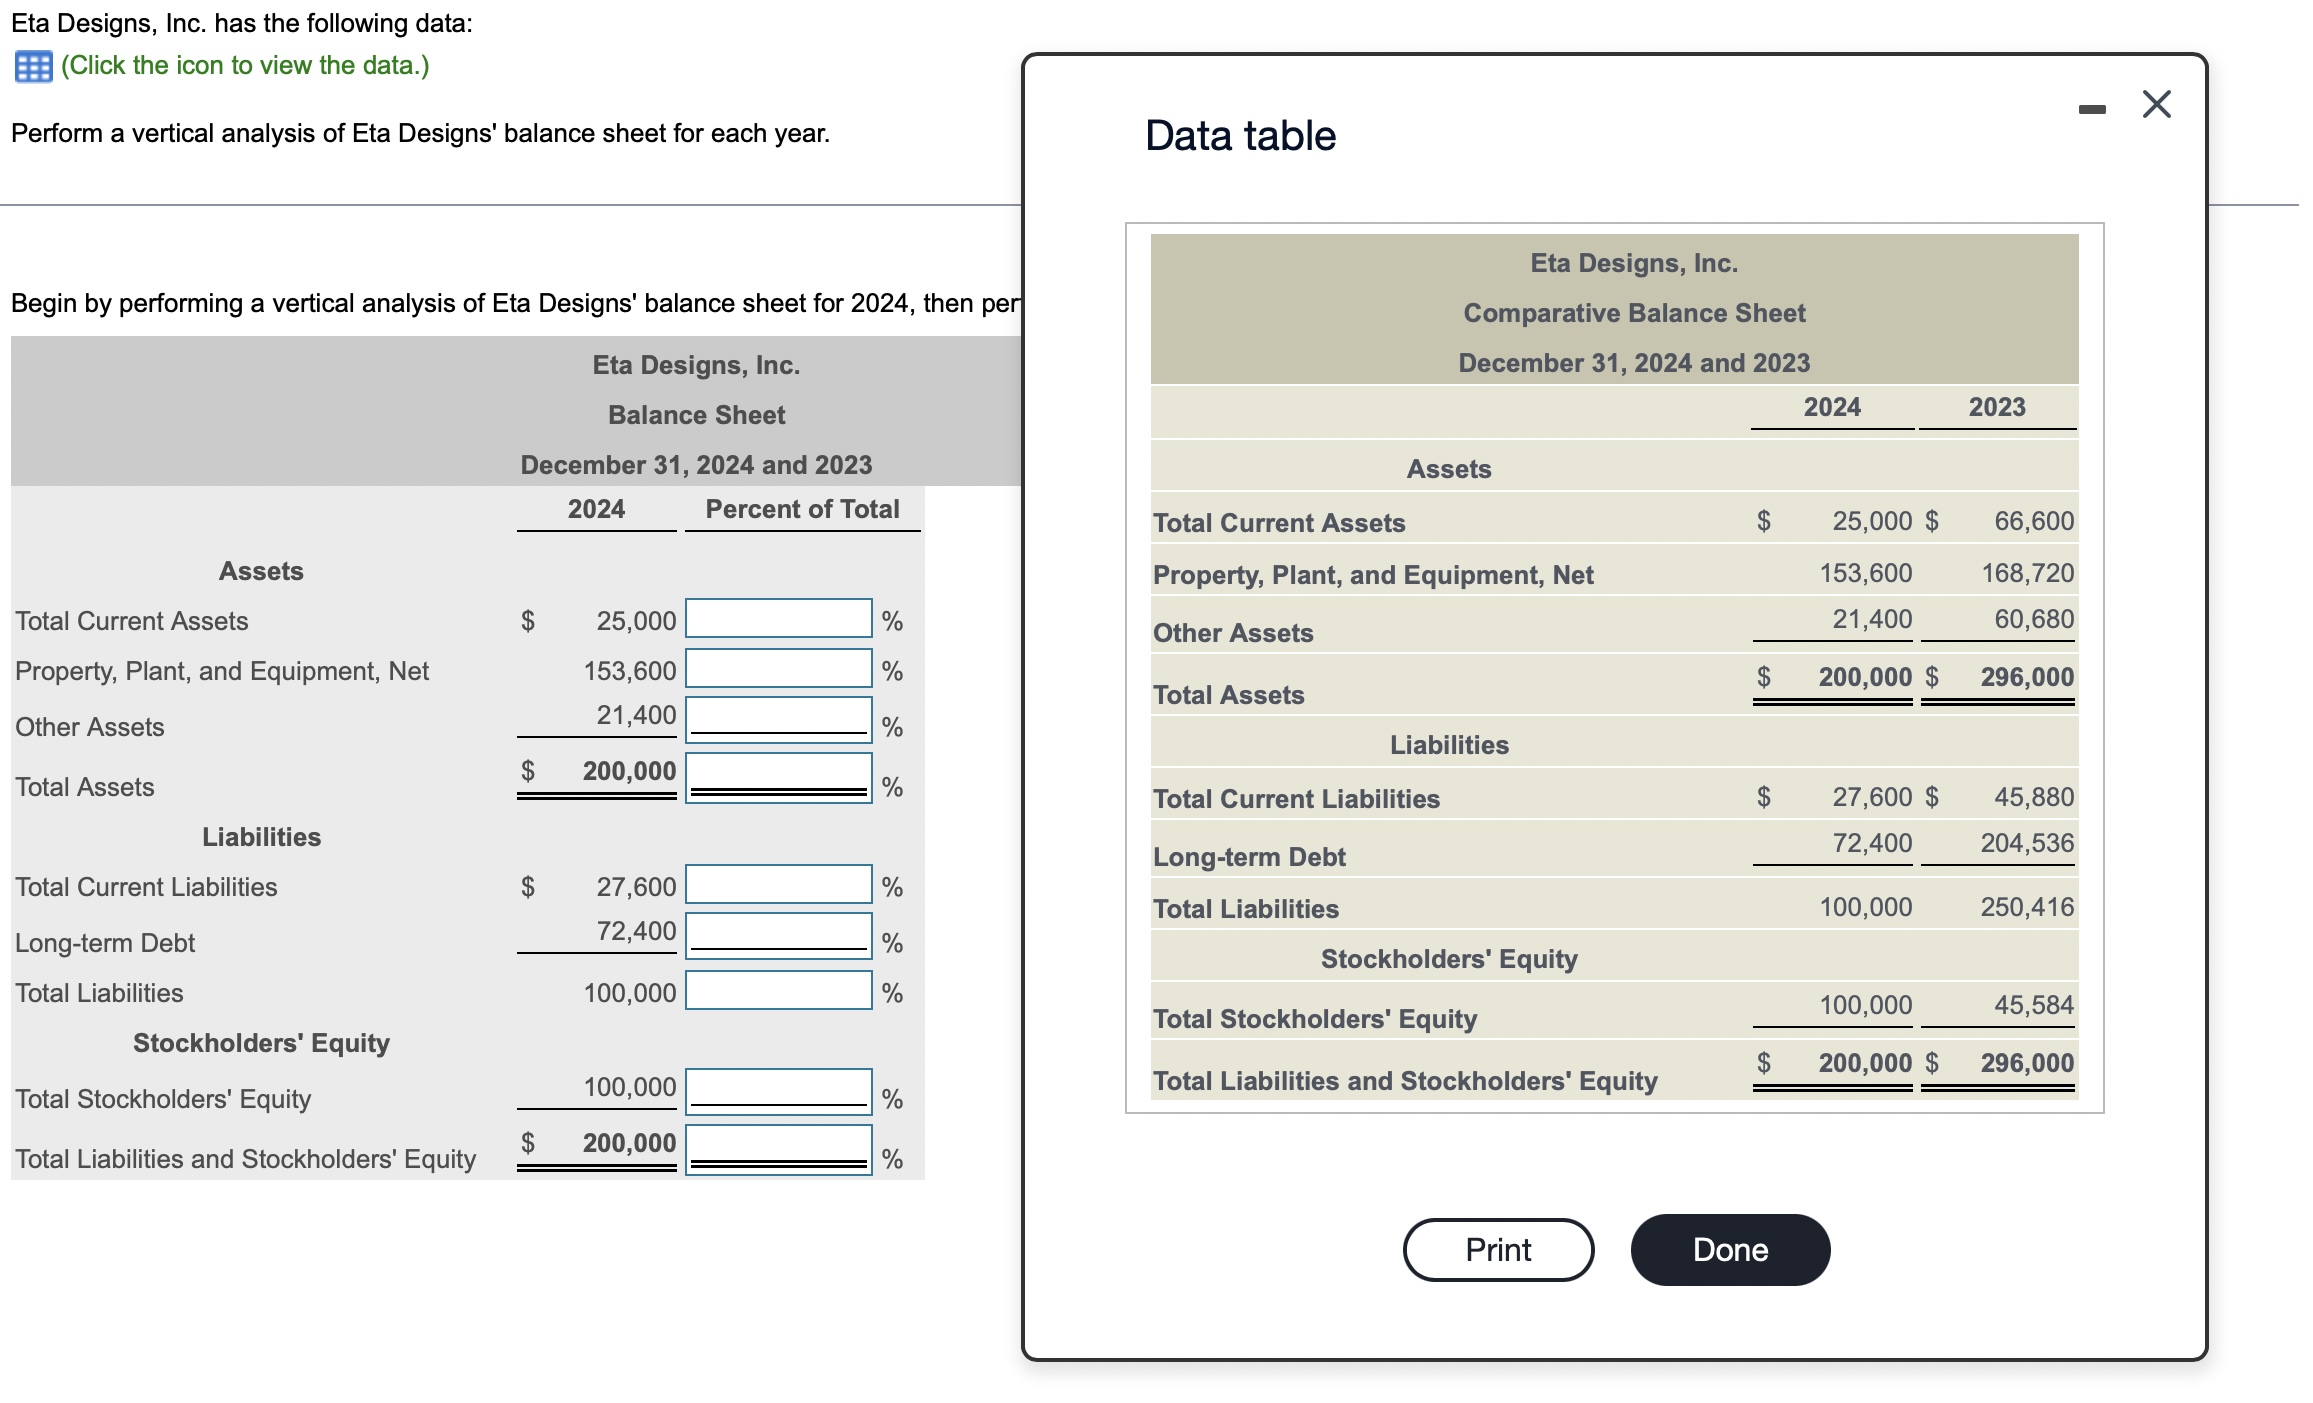
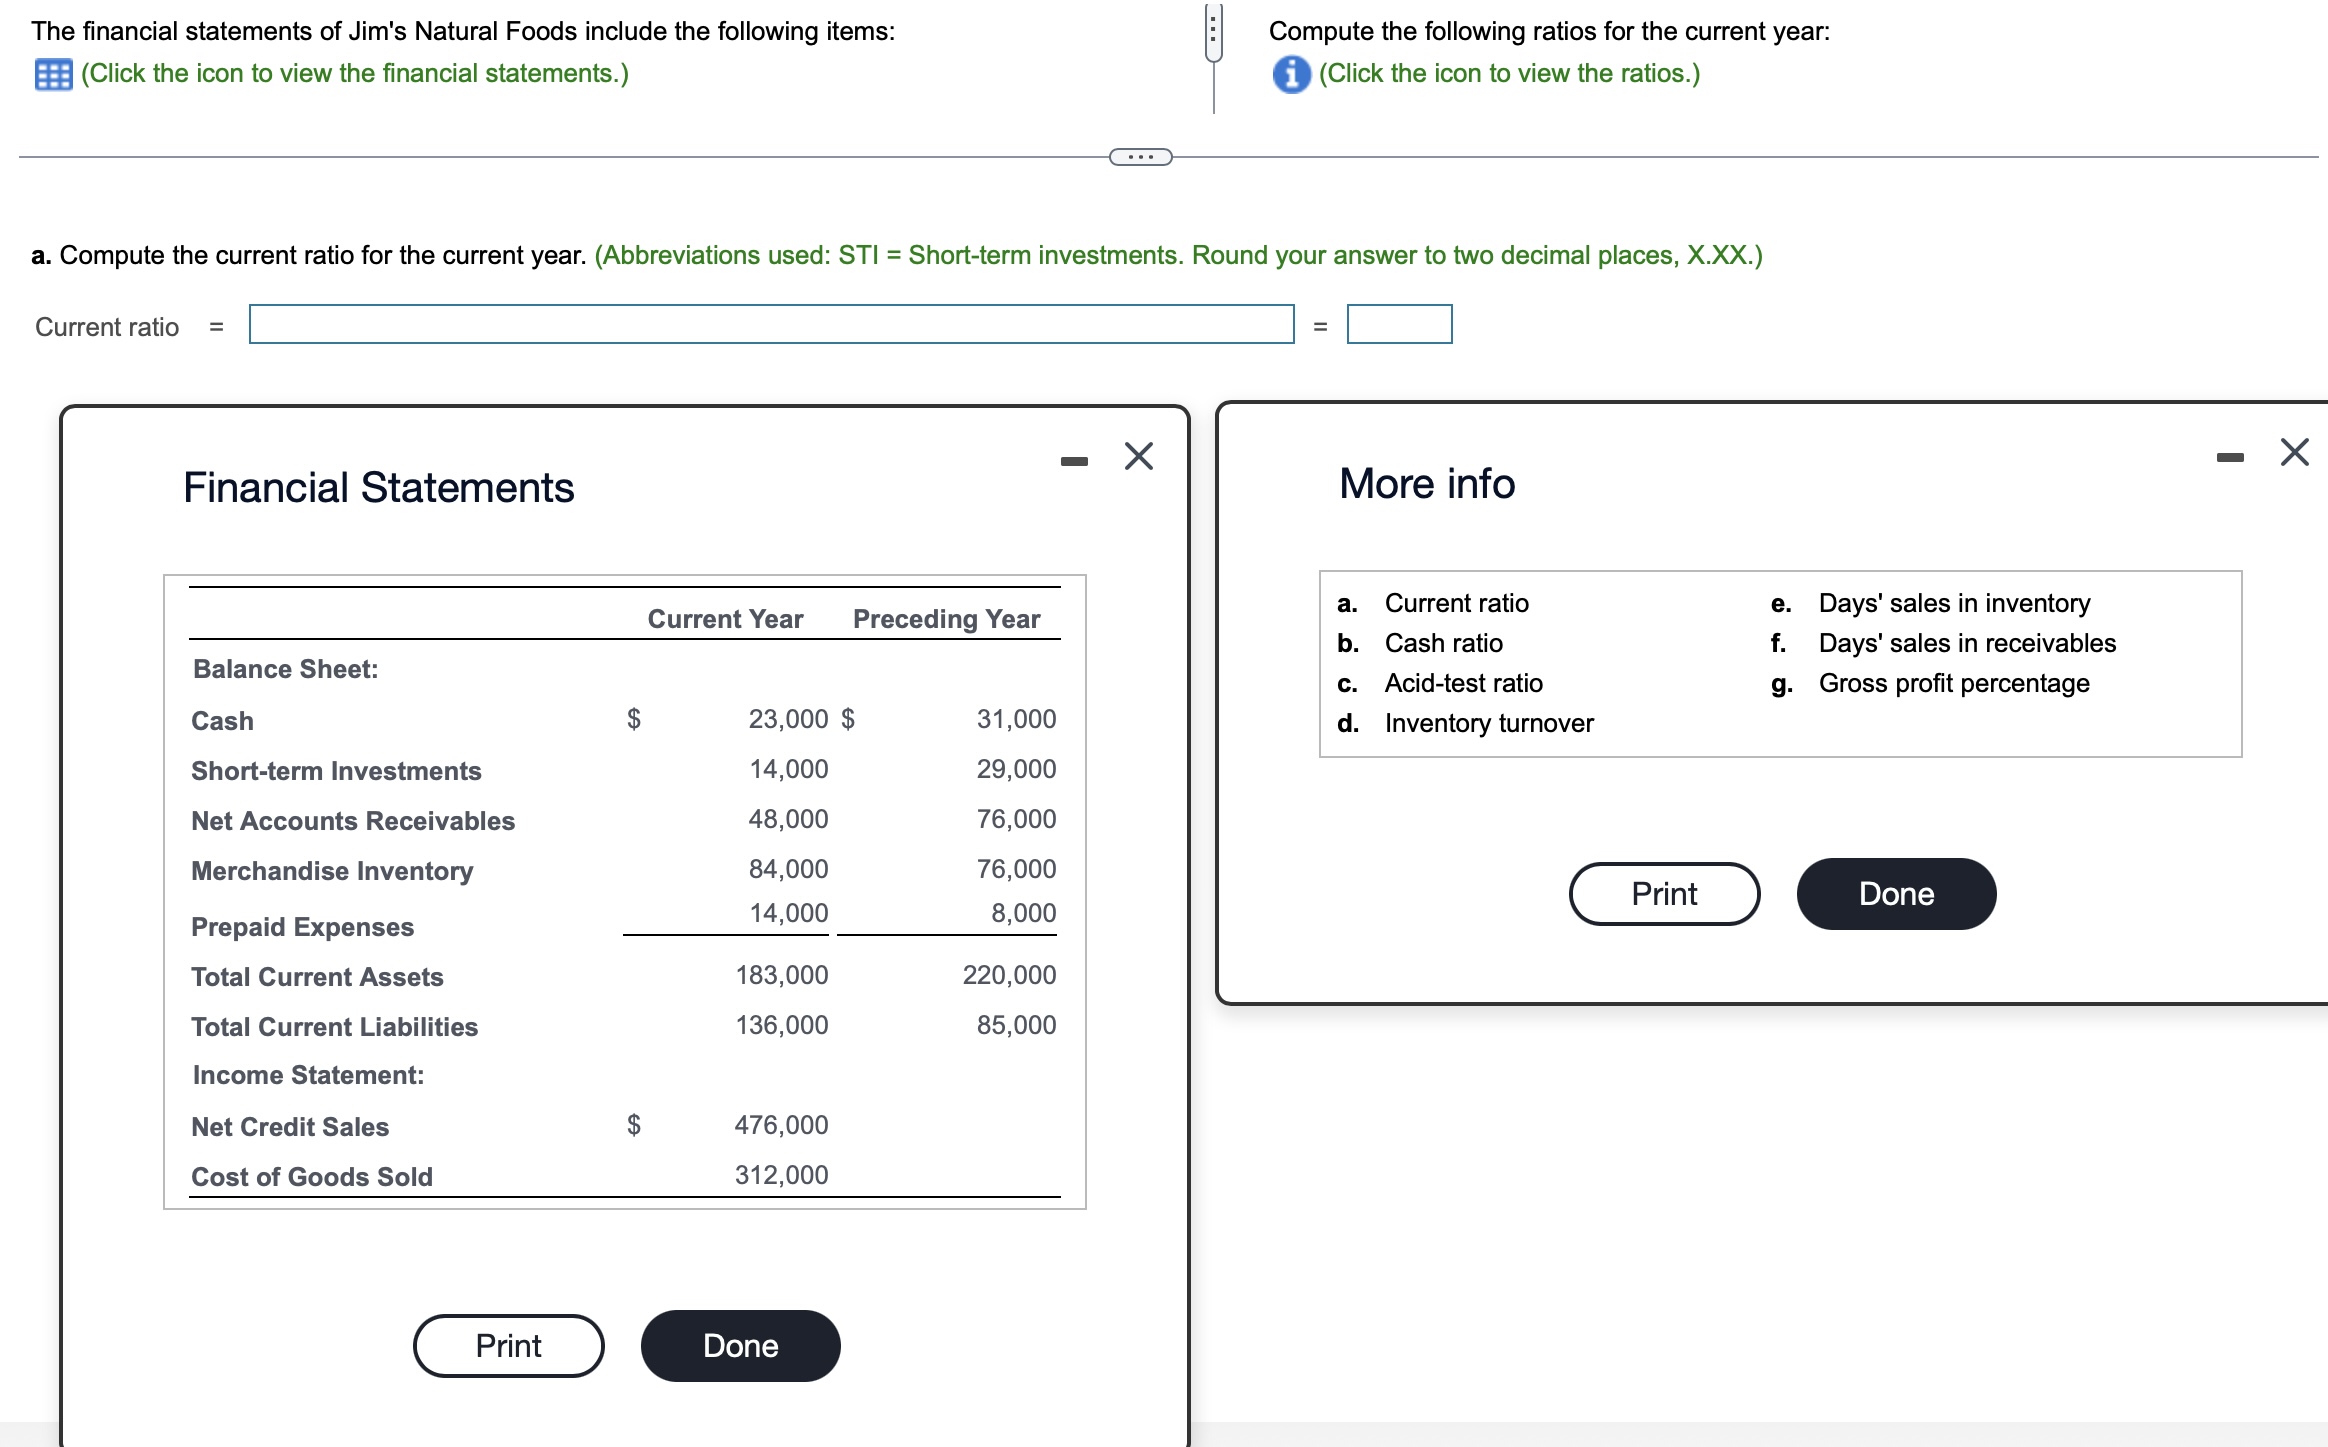
Data for Hooser Designs, Inc. follow: @ (Click the icon to view the data.) Data table Read the uirements. Hooser Designs, Inc. Comparative Income Statement Requirement 1. Prepare a horizontal analysis of the comparative income statement of Hooser Designs, In decimal place, X.X%. Use a minus sign or parentheses to indicate a decrease.) Years Ended December 31' 2024 and 2023 2024 2023 Hooser Designs, Inc. . Net Sales Revenue $ 429,000 $ 374,650 Comparative Income Statement Years Ended December 31, 2024 and 2023 EXpenseS: Cost of Goods Sold 203,000 189,000 Increase (Decrease) 2024 2023 Amount Percentage Selling and Administrative Expenses 96,000 92,000 8,350 3,000 Net Sales Revenue $ 429,000 $ 374,650 $ 54,350 14.5 % Other Expenses EXPenses: Total Expenses Cost of Goods Sold 203,000 189,000 14,000 % Net Income $ 121,650 $ 90,650 Selling and Administrative Expenses 96,000 92,000 4,000 % Other Expenses 8'350 % _ Total Expenses 307'350 284'000 % ReqUIrementS Net Income $ 121,650 $ 90,650 $ 31,000 % 1. Prepare a horizontal analysis of the comparative income statement of Hooser Designs, Inc. Round percentage changes to one decimal place. 2. Why did 2024 net income increase by a higher percentage than net sales revenue? -153 Eta Designs, Inc. has the following data: a (Click the icon to view the data.) Perform a vertical analysis of Eta Designs' balance sheet for each year. Data tabIe Eta Designs, Inc. Begin by performing a vertical analysis of Eta Designs' balance sheet for 2024, then pe Comparative Balance Sheet Eta Designs, Inc. December 31, 2024 and 2023 Balance Sheet 224 2023 December 31, 2024 and 2023 Assets $ M Total Current Assets 25,000 $ 66,600 Assets Property, Plant, and Equipment, Net 153,600 168,720 Total Current Assets $ 25,000 % Other Assets 21,400 60,680 Property, Plant, and Equipment, Net 153,600 % 200 000 $ 296 000 21 400 Total Assets ' =' l 0 Other Assets $ A' Liabilities 200,000 Total Assets % Total Current Liabilities 27,600 $ 45.880 Liabilities Long-term Debt 72'400 Total Current Liabilities $ 27,600 % 72 400 Total Liabilities 100,000 250,416 _ r 0 Long term Debt A Stockholders' Equity Total Liabilities 100,000 % Total Stockholders' Equity Stockholders' Equity 200 000 $ 296 000 Total Stockholders, Equity 100,000 % Total Liabilities and Stockholders Equity = Total Liabilities and Stockholders' Equity w % -153 The nancial statements of Jim's Natural Foods include the following items: a (Click the icon to view the nancial statements.) Compute the following ratios for the current year: 0 (Click the icon to view the ratios.) a. Compute the current ratio for the current year. (Abbreviations used: STI = Short-term investments. Round your answer to two decimal places, X.XX.) Current ratio Financial Statements Current Year Preceding Year Balance Sheet: Cash Short-term Investments Net Accounts Receivables Merchandise Inventory Prepaid Expenses Total Current Assets Total Current Liabilities Income Statement: Net Credit Sales Cost of Goods Sold 23,000 $ 14,000 48,000 84,000 14,000 183,000 136,000 476,000 312,000 31,000 29,000 76,000 76,000 8,000 220,000 85,000 -153 More info a. Current ratio e. Days' sales in inventory b. Cash ratio f. Days' sales in receivables c. Acid-test ratio 9. Gross prot percentage d. Inventory turnover -153
Step by Step Solution
There are 3 Steps involved in it

Get step-by-step solutions from verified subject matter experts