

Question: please help Refer to the Operating Cash Flow Margin Analysis Dashboard below and answer the questions. (Note that for all questions below you may select
please help 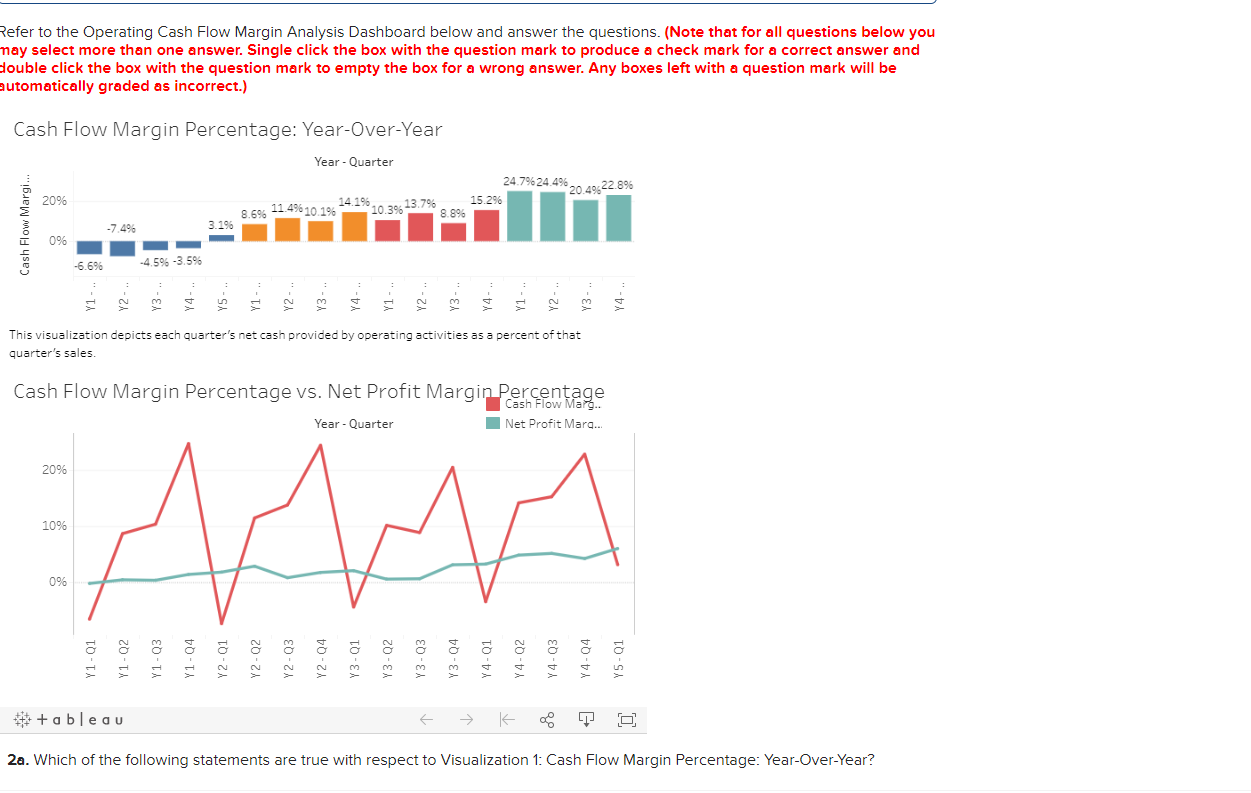
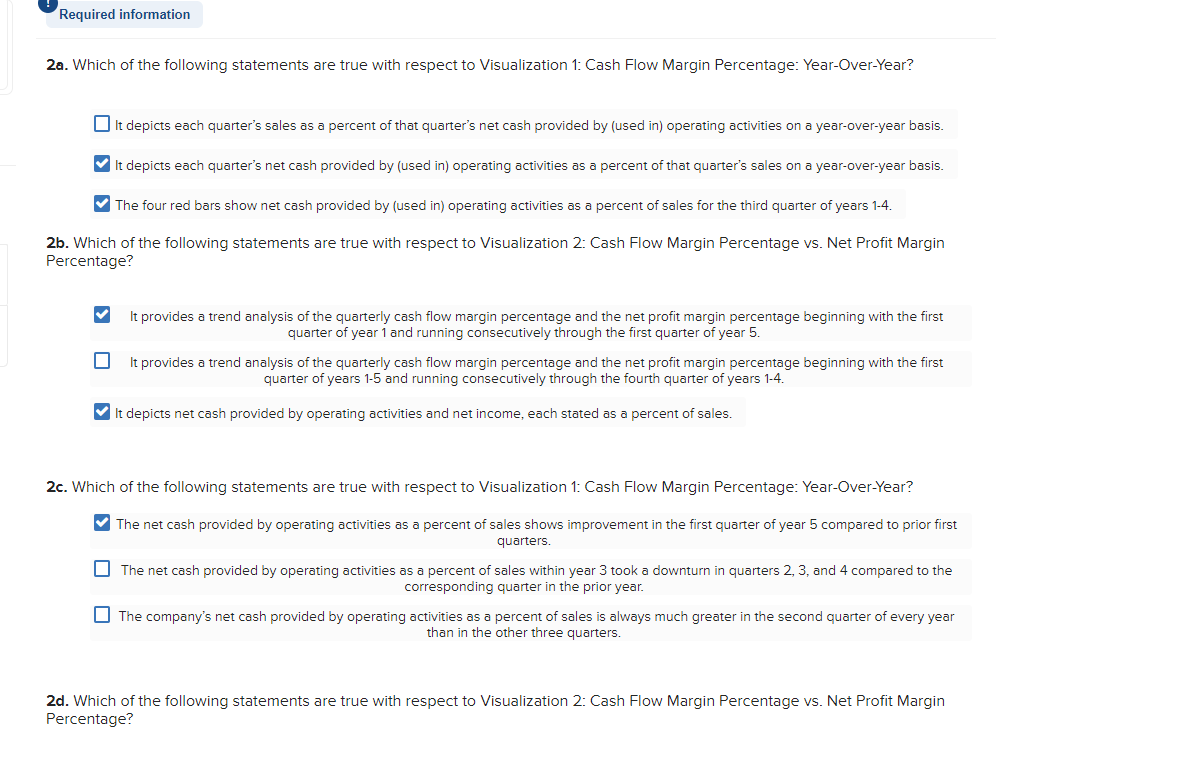
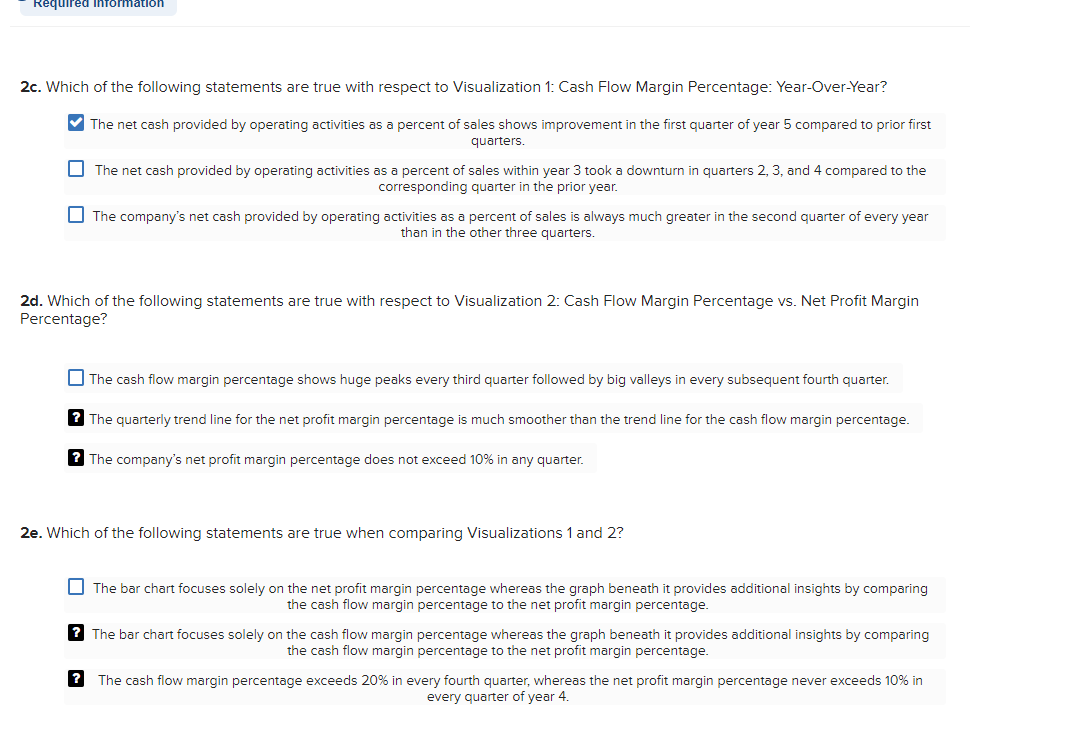
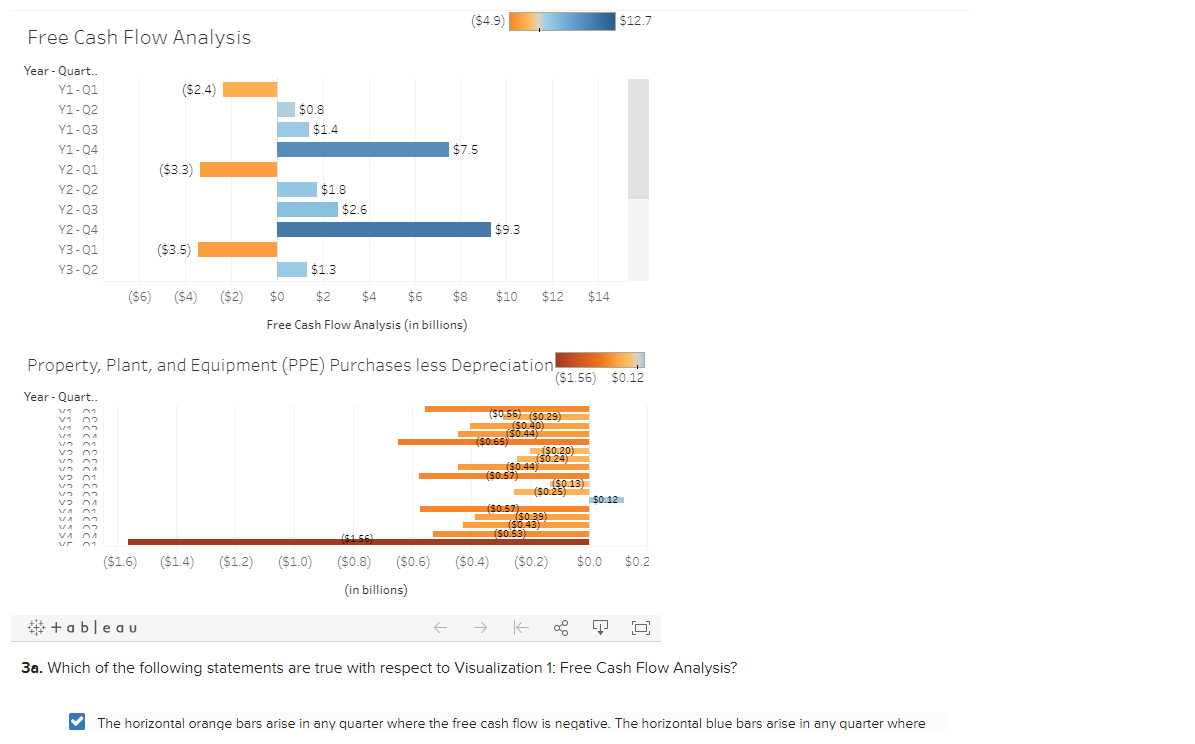
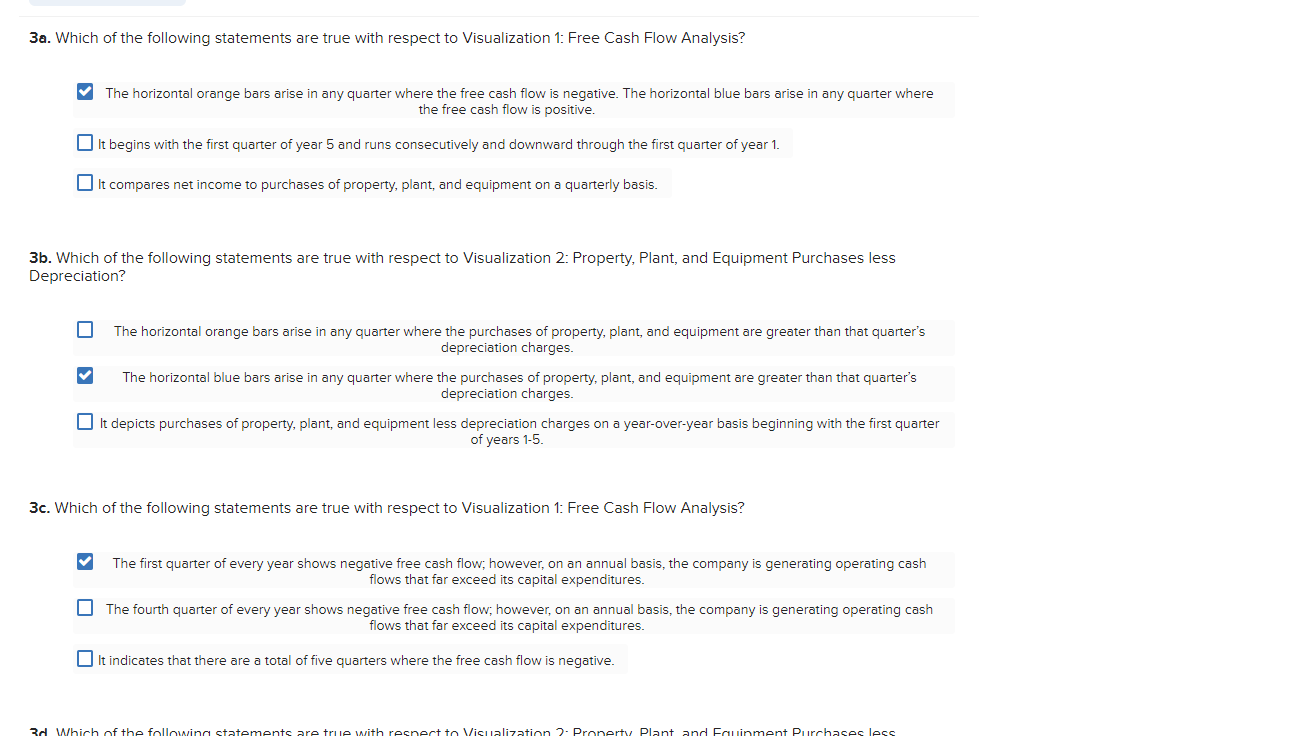
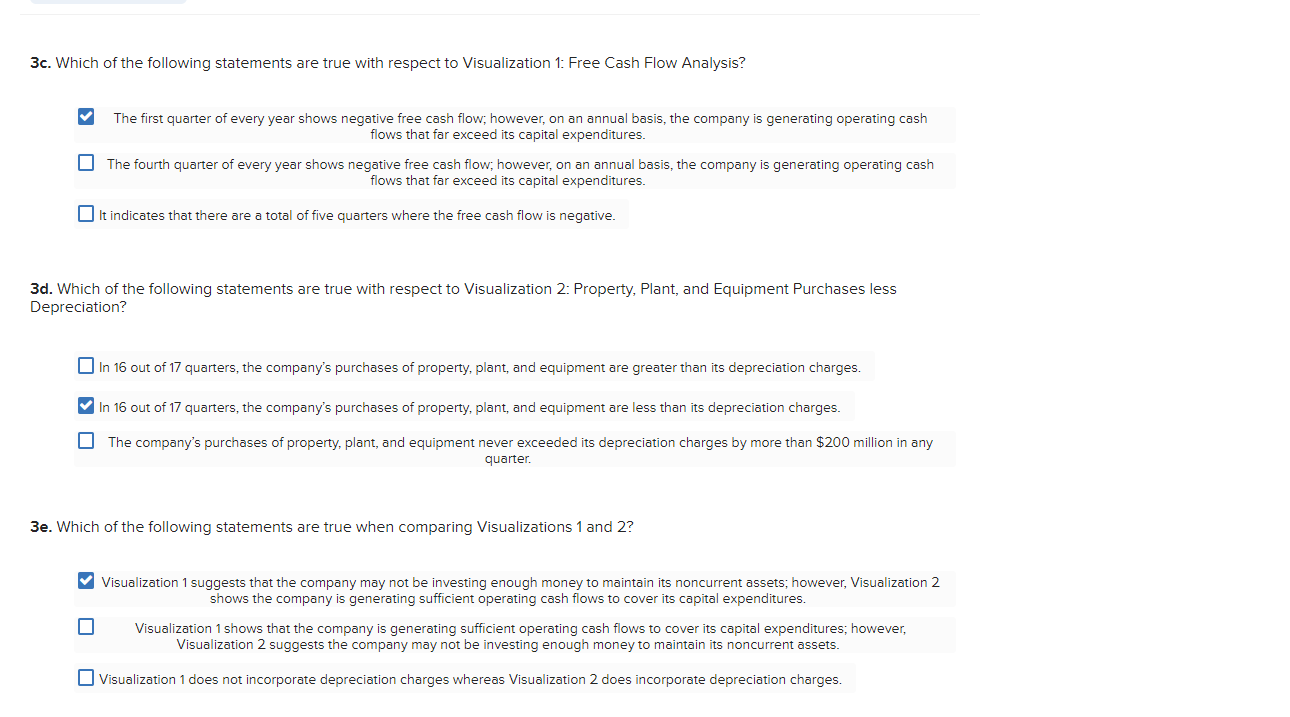
Refer to the Operating Cash Flow Margin Analysis Dashboard below and answer the questions. (Note that for all questions below you may select more than one answer. Single click the box with the question mark to produce a check mark for a correct answer and double click the box with the question mark to empty the box for a wrong answer. Any boxes left with a question mark will be automatically graded as incorrect.) Cash Flow Margin Percentage: Year-Over-Year Year - Quarter 24.7%24.49 15.296 14.1% 10.39 13.7% 8.69 11.4% 10.104 8.8% 20.4922.8% 20% -7.4% 09 -6.696 -4.5% -3.5% S 5 This visualization depicts each quarter's net cash provided by operating activities as a percent of that quarter's sales. Cash Flow Margin Percentage vs. Net Profit Margin Percentage Cash Flow Marg.. Net Profit Mara... Year - Quarter 20% 10% 0% Y1-03 10-TA 12-01 12-02 Y2-03 Y2-04 Y3.01 Y3-02 Y3-03 Y3-04 Y4-01 Y4-02 Y 4-Q3 Y5-01 # + ableau TO 2a. Which of the following statements are true with respect to Visualization 1: Cash Flow Margin Percentage: Year-Over-Year? Required information 2a. Which of the following statements are true with respect to Visualization 1: Cash Flow Margin Percentage: Year-Over-Year? It depicts each quarter's sales as a percent of that quarter's net cash provided by (used in) operating activities on a year-over-year basis. It depicts each quarter's net cash provided by (used in) operating activities as a percent of that quarter's sales on a year-over-year basis. The four red bars show net cash provided by (used in) operating activities as a percent of sales for the third quarter of years 1-4. 2b. Which of the following statements are true with respect to Visualization 2: Cash Flow Margin Percentage vs. Net Profit Margin Percentage? It provides a trend analysis of the quarterly cash flow margin percentage and the net profit margin percentage beginning with the first quarter of year 1 and running consecutively through the first quarter of year 5. It provides a trend analysis of the quarterly cash flow margin percentage and the net profit margin percentage beginning with the first quarter of years 1-5 and running consecutively through the fourth quarter of years 1-4. It depicts net cash provided by operating activities and net income, each stated as a percent of sales. 2c. Which of the following statements are true with respect to Visualization 1: Cash Flow Margin Percentage: Year-Over-Year? The net cash provided by operating activities as a percent of sales shows improvement in the first quarter of year 5 compared to prior first quarters. The net cash provided by operating activities as a percent of sales within year 3 took a downturn in quarters 2, 3, and 4 compared to the corresponding quarter in the prior year. The company's net cash provided by operating activities as a percent of sales is always much greater in the second quarter of every year than in the other three quarters. 2d. Which of the following statements are true with respect to Visualization 2: Cash Flow Margin Percentage vs. Net Profit Margin Percentage? Required information 2c. Which of the following statements are true with respect to Visualization 1: Cash Flow Margin Percentage: Year-Over-Year? The net cash provided by operating activities as a percent of sales shows improvement in the first quarter of year 5 compared to prior first quarters. The net cash provided by operating activities as a percent of sales within year 3 took a downturn in quarters 2, 3, and 4 compared to the corresponding quarter in the prior year. The company's net cash provided by operating activities as a percent of sales is always much greater in the second quarter of every year than in the other three quarters. 2d. Which of the following statements are true with respect to Visualization 2: Cash Flow Margin Percentage vs. Net Profit Margin Percentage? The cash flow margin percentage shows huge peaks every third quarter followed by big valleys in every subsequent fourth quarter. ? The quarterly trend line for the net profit margin percentage is much smoother than the trend line for the cash flow margin percentage. The company's net profit margin percentage does not exceed 10% in any quarter. 2e. Which of the following statements are true when comparing Visualizations 1 and 2? The bar chart focuses solely on the net profit margin percentage whereas the graph beneath it provides additional insights by comparing the cash flow margin percentage to the net profit margin percentage. 2 The bar chart focuses solely on the cash flow margin percentage whereas the graph beneath it provides additional insights by comparing the cash flow margin percentage to the net profit margin percentage. 1 The cash flow margin percentage exceeds 20% in every fourth quarter, whereas the net profit margin percentage never exceeds 10% in every quarter of year 4 ($4.9) $12.7 Free Cash Flow Analysis ($2.4) $0.8 $1.4 Year - Quart.. Y1-01 Y1-02 Y1-03 Y1-04 Y2-01 Y2-02 Y2-03 Y2-04 $7.5 ($3.3) $1.8 $2.6 $9.3 Y3-01 ($3.5) Y3-02 $1.3 (56) (54) ($2) $10 $12 $14 $0 $2 $4 $6 $8 Free Cash Flow Analysis (in billions) Property, Plant, and Equipment (PPE) Purchases less Depreciation ($1.56) $0.12 Year - Quart. V1 ($0.85,-0.49 V (50-56) - S029) ($0.40) ( ($0.20) S0.24) (S0.44) (S0.57) $0.13) ($0.25) $0.12 (SO.57) TS0.39) IS0.43) (S.53) V 1 V vo * V VA VA VA VA A 6156 ($1.6) ($1.4) ($1.2) ($1.0) ($0.8) ($0.6) ($0.4) ($0.2) $0.0 $0.2 (in billions) #tableau > K TO 3a. Which of the following statements are true with respect to Visualization 1: Free Cash Flow Analysis? The horizontal orange bars arise in any quarter where the free cash flow is negative. The horizontal blue bars arise in any quarter where 3a. Which of the following statements are true with respect to Visualization 1: Free Cash Flow Analysis? The horizontal orange bars arise in any quarter where the free cash flow is negative. The horizontal blue bars arise in any quarter where the free cash flow is positive. It begins with the first quarter of year 5 and runs consecutively and downward through the first quarter of year 1. It compares net income to purchases of property, plant, and equipment on a quarterly basis. 3b. Which of the following statements are true with respect to Visualization 2: Property, Plant, and Equipment Purchases less Depreciation? The horizontal orange bars arise in any quarter where the purchases of property, plant, and equipment are greater than that quarter's depreciation charges The horizontal blue bars arise in any quarter where the purchases of property, plant, and equipment are greater than that quarter's depreciation charges. It depicts purchases of property, plant, and equipment less depreciation charges on a year-over-year basis beginning with the first quarter of years 1-5. 3c. Which of the following statements are true with respect to Visualization 1: Free Cash Flow Analysis? The first quarter of every year shows negative free cash flow; however, on an annual basis, the company is generating operating cash flows that far exceed its capital expenditures. The fourth quarter of every year shows negative free cash flow; however, on an annual basis, the company is generating operating cash flows that far exceed its capital expenditures. I It indicates that there are a total of five quarters where the free cash flow is negative. 20 Which of the following statements are true with resnect to Visualization - Pronerty Plant and Fruinment Purchases less 3c. Which of the following statements are true with respect to Visualization 1: Free Cash Flow Analysis? The first quarter of every year shows negative free cash flow, however, on an annual basis, the company is generating operating cash flows that far exceed its capital expenditures. The fourth quarter of every year shows negative free cash flow; however, on an annual basis, the company is generating operating cash flows that far exceed its capital expenditures. It indicates that there are a total of five quarters where the free cash flow is negative. 3d. Which of the following statements are true with respect to Visualization 2: Property, Plant, and Equipment Purchases less Depreciation? In 16 out of 17 quarters, the company's purchases of property, plant, and equipment are greater than its depreciation charges. In 16 out of 17 quarters, the company's purchases of property, plant, and equipment are less than its depreciation charges. The company's purchases of property, plant, and equipment never exceeded its depreciation charges by more than $200 million in any quarter 3e. Which of the following statements are true when comparing Visualizations 1 and 2? Visualization 1 suggests that the company may not be investing enough money to maintain its noncurrent assets; however, Visualization 2 shows the company is generating sufficient operating cash flows to cover its capital expenditures. Visualization 1 shows that the company is generating sufficient operating cash flows to cover its capital expenditures; however, Visualization 2 suggests the company may not be investing enough money to maintain its noncurrent assets. Visualization 1 does not incorporate depreciation charges whereas Visualization 2 does incorporate depreciation charges
Step by Step Solution
There are 3 Steps involved in it

Get step-by-step solutions from verified subject matter experts