

Question: please help Refer to the table Factors for Computing Control Chart Limits ( 3 sigma) for this problem. A process at Amit Eynan Bottling Company
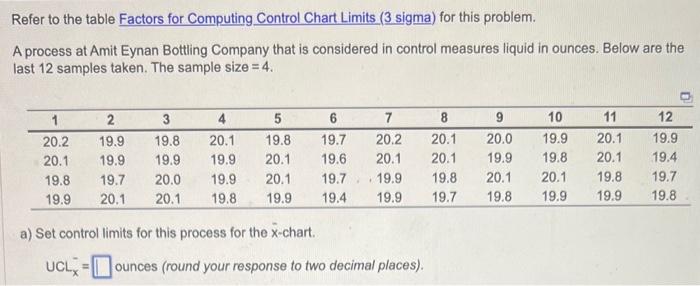
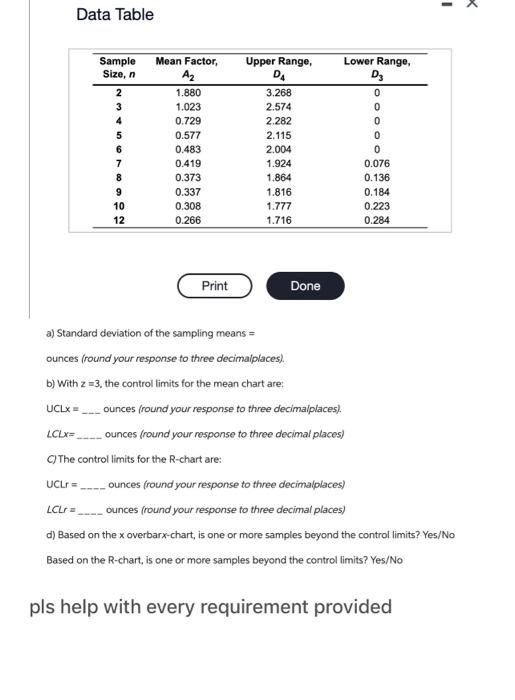
Refer to the table Factors for Computing Control Chart Limits ( 3 sigma) for this problem. A process at Amit Eynan Bottling Company that is considered in control measures liquid in ounces. Below are the last 12 samples taken. The sample size =4. a) Set control limits for this process for the x-chart. UCLx=ounces (round your response to two decimal places). Data Table a) Standard deviation of the sampling means = ounces (round your response to three decimalplaces). b) With z=3, the control limits for the mean chart are: UCLx= ounces (round your response to three decimalplaces). CLx= ounces (round your response to three decimal places) C) The control limits for the R-chart are: CLr= ounces (round your response to three decimalplaces) LCLr = ounces (round your response to three decimal places) d) Based on the x overbarx-chart, is one or more samples beyond the control limits? Yes/No Based on the R-chart, is one or more samples beyond the control limits? Yes/No pls help with every requirement provided
Step by Step Solution
There are 3 Steps involved in it

Get step-by-step solutions from verified subject matter experts