

Question: please help show what graph will look like on excel (scatter plot, bar graph, or line graph) and include x and y axis. may be
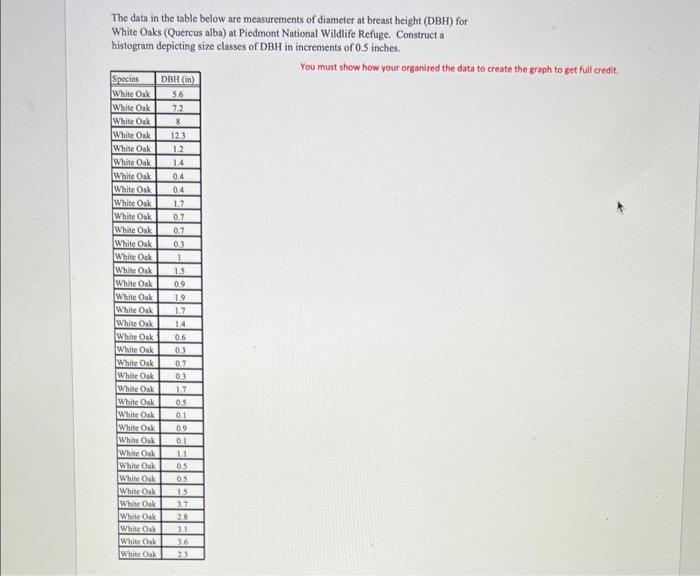
The data in the table below are measurements of diameter at breast height (DBH) for White Oaks (Quercus alba) at Piedmont National Wildlife Refuge. Construct a histogram depicting size classes of DBH in increments of 0.5 inches. You must show how your organized the data to create the graph to get full credit. Species DBH (I) White Oak 5.6 White Oak White Oak White Oak White Oak White Oak White Oak White Oak White Oak White Oak White Oak White Oak White Oak White Oak White Oak White Oak White Oak White Oak White Oak White Oak White Oak White Oak White Oak White Oak White Oak White Oak White Oak White Oak White Oak White Oak 05 White Oak 15 White Oak 3.7 White Ok 28 White Oak 31 White OAK White Oak 21 REFERENTIELLE
Step by Step Solution
There are 3 Steps involved in it

Get step-by-step solutions from verified subject matter experts