

Question: Please I really need help with my lab. please.We're to use a pHet stimulation: charges and fields. Link: https://phet.colorado.edu/en/simulation/charges-and-fields Instructions: We will be taking satay
Please I really need help with my lab. please.We're to use a pHet stimulation: charges and fields. Link: https://phet.colorado.edu/en/simulation/charges-and-fields Instructions: We will be taking satay on how the electric field strength depends on the distance and direction away from the charges. You can use the grid lines to get a sense of distance, but the tape measure (drag it from the right) can provide a more precise value. (After filling in the tables, we will have do graph it and then answer the discussion questions.) please I really need you to help me. Discussion questions:1.) Many relationships in nature follow a power law with integer exponents. Which of the scenarios that you tested have curve fits with exponents that are very close to integers? If the exponents is close to but not exactly, an Integer in your plot what is your interpretation? (Consider how precisely you're able to position the sensor in the stimulation) 2.) Rank the four sceneries according to how rapidly the electric field decreases with distance. Explain your choices. Use the curve fit equations in your plots (with rounded exponents values) to help you with the ranking. 3.) Which scenario(s) closely followed Coulomb's law? What does this make sense? 4.) Describe how the electric field above a line charge (scenario 2) varies along a direction parallel to the line of charges.5.) Describe how the electric field varies as you go in a circle around a dipole.
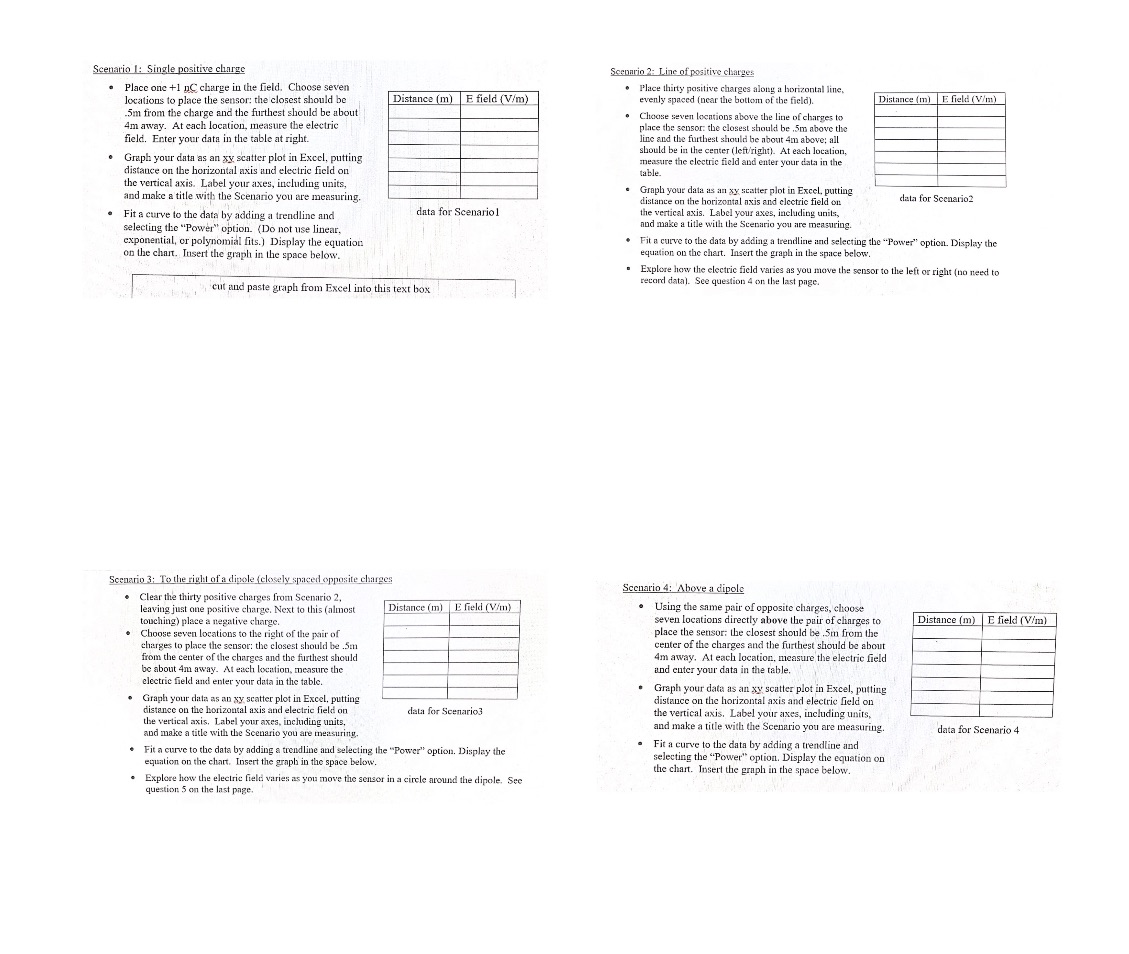
Scenario 1: Single positive charge Scenario 2: Line of positive charges Place one +1 no charge in the field. Choose seven Place thirty positive charges along a horizontal line. locations to place the sensor: the closest should be Distance (m) E field (V/m) evenly spaced (near the bottom of the field). Distance (m) |E field (V/m) -5m from the charge and the furthest should be about . Choose seven locations above the line of charges to Im away. At each location, measure the electric place the sensor: the closest should be .5m above the field. Enter your data in the table at right. line and the furthest should be about 4m above; all should be in the center (left/right). At each location, . Graph your data as an zy scatter plot in Excel, putting measure the electric field and enter your data in the distance on the horizontal axis and electric field on table the vertical axis. Label your axes, including units, Graph your data as an xy scatter plot in Excel, putting and make a title with the Scenario you are measuring. distance on the horizontal axis and electric field on data for Scenario? Fit a curve to the data by adding a trendline and data for Scenario the vertical axis. Label your axes, including units, selecting the "Power" option. (Do not use linear. and make a title with the Scenario you are measuring exponential, or polynomial fits.) Display the equation Fit a curve to the data by adding a trendline and selecting the "Power" option. Display the on the chant. Insert the graph in the space below. equation on the chart. Insert the graph in the space below. Explore how the electric field varies as you move the sensor to the left or right (no need to record data). See question 4 on the last page. cut and paste graph from Excel into this text box Scenario 3: To the right of a dipole fclosely spaced opposite charges Scenario 4: Above a dipole Clear the thirty positive charges from Scenario 2, leaving just one positive charge. Next to this (almost Distance (m) |E field (V/m) Using the same pair of opposite charges, choose touching) place a negative charge. seven locations directly above the pair of charges to Distance (m) E field (V/m) Choose seven locations to the right of the pair of place the sensor: the closest should be .5m from the charges to place the sensor: the closest should be .5m center of the charges and the furthest should be about from the center of the charges and the furthest should 4m away. At each location, measure the electric field be about 4m away. At each location, measure the and cuter your data in the table. electric field and enter your data in the table. Graph your data as an xy scatter plot in Excel, putting Graph your data as an xy scatter plot in Excel, putting distance on the horizontal axis and electric field on distance on the horizontal axis and electric field on data for Scenario3 the vertical axis. Label your axes, including units, the vertical axis, Label your axes, including units, and make a title with the Scenario you are measuring. and make a title with the Scenario you are measuring. data for Scenario 4 Fit a curve to the data by adding a trendline and selecting the "Power" option. Display the Fit a curve to the data by adding a trendline and equation on the chart. Insert the graph in the space below. selecting the "Power" option. Display the equation on the chart. Insert the graph in the space below. Explore how the electric field varies as you move the sensor in a circle around the dipole. See question 5 on the last page
Step by Step Solution
There are 3 Steps involved in it

Get step-by-step solutions from verified subject matter experts