

Question: Please help so confused! Historical returns. Calculate the arithmetic average return of U.S. Treasury bills, long-term govemment bonds, and large-company stocks for 1986 to 1995.
Please help so confused!
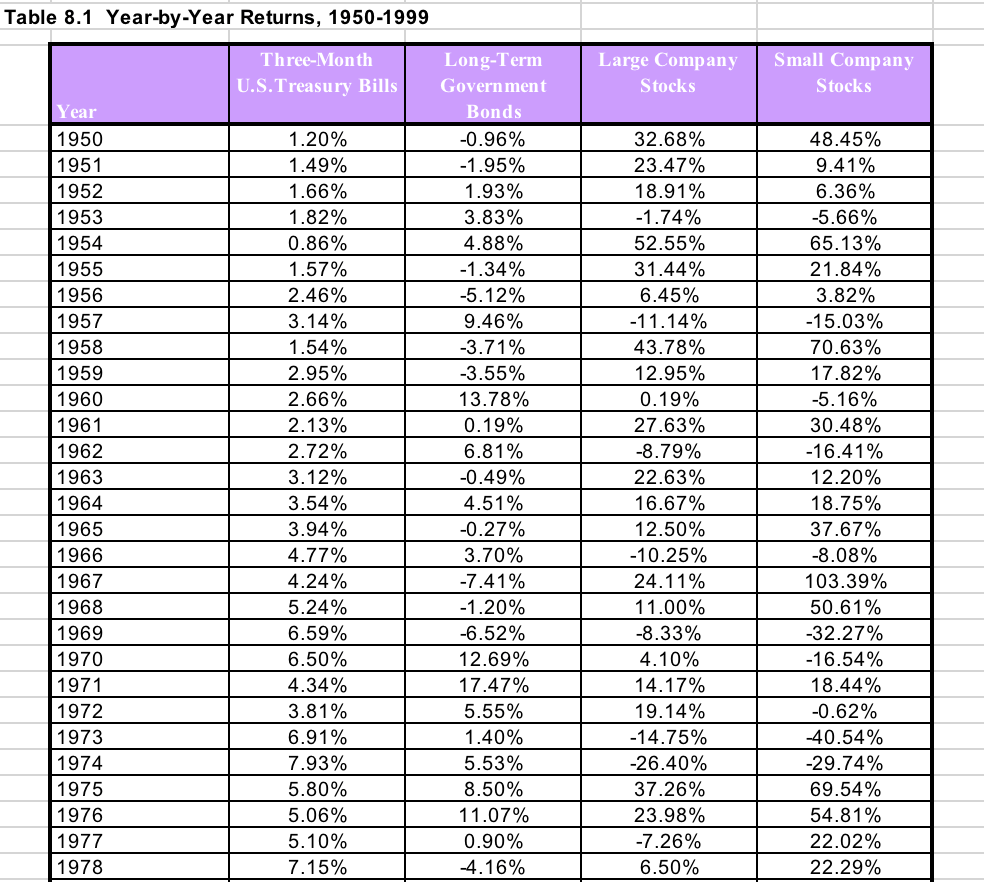
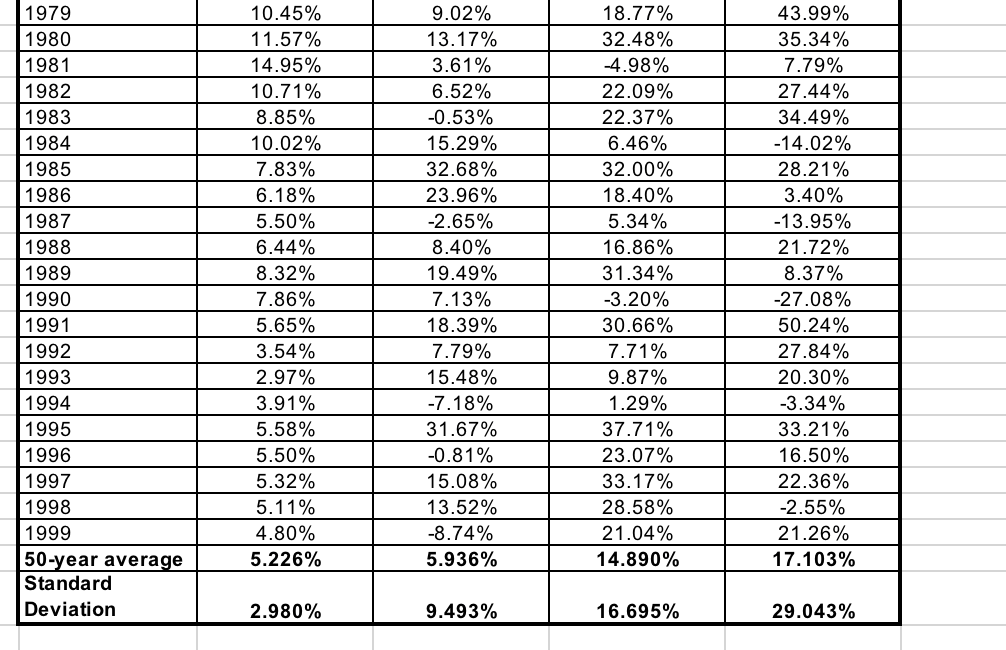
Historical returns. Calculate the arithmetic average return of U.S. Treasury bills, long-term govemment bonds, and large-company stocks for 1986 to 1995. Which had the highest return? Which had the lowest return? On the left side, click on the Spreadsheet Learning Aid to see Table 8.1-Year-by-Year Returns, 1950-1999 What is the average return of U.S. Treasury bills for 1986 to 1995? % (Round to two decimal places.) Table 8.1 Year-by-Year Returns, 1950-1999 Company Small Company Long-Term Government Large U.S. Treasury Bills 1.20% 149% 1.66% 1.82% 0.86% 57 % 2.46% -0.96% -1.95% 1.93% 3.83% 4.88% 1950 1951 1952 1953 1954 1955 1956 1957 1958 1959 1960 1961 1962 1963 1964 1965 1966 1967 1968 1969 1970 1971 1972 1973 1974 1975 1976 1977 1978 48.45% 6.36% 65.13% 32.68% 23.47% 0 -5.66% 52.55% 31,44% 6.45% .14% 43.78% 12.95% 3.82% 0 3.14% 1.54% 2.95% 2.66% -15.03% 70.63% 17.82% 0 30.48% 9.46% 0 -3.55% 13.78% 27.63% -8.79% 22.63% 16.67% 12.50% -10.25% 272% 0 0 -0.49% 12.20% -54% 3.94% 18.75% 31 ,87% -O27% 3 7 0% -8.08% 103.39% 50.61% 3227% -10.54% 4.24% 11 .00% -8.33% -1.20% -6.52% 12.69% 17.47% 5.55% 1.40% 5.53% 8.50% 11 .07% 0.90% 6.59% 6.50% 4.34% 18.44% 0 -14.75% -26.40% 31255% 23.98% -720% 6.50% -0.62% 40.54% -29.74% 69.54% 0 22.02% 22.29% 5.80% 5.06% -10% 4921 5 1065 097 70283 3 6 3 7440 3253 2 520 7448 2312 70703 3622 7 4 82522 2 2 0 8970 9036 6043 4832 613 849 749 2617917 70150 73381 32322 2 2 2 0 0-09988 123986 655-269 3 52328 27% 9 2 805 3 3 9 3 6 57515 4597 0140 380426547180210 8-5 4 3 8 6 5 9 955318 10 7656375323555545 rr o aa ti -ed at 9999999999999999999990 ta e 901234567890123456789 700 | 8 | 8 | 8 | 8-8-8-8-8-8-9-9-9-9-9-9-9-9-9-9
Step by Step Solution
There are 3 Steps involved in it

Get step-by-step solutions from verified subject matter experts