

Question: Please help solve A B D G M The XYZ production company are making a production plan for Month 21, for each of their eight
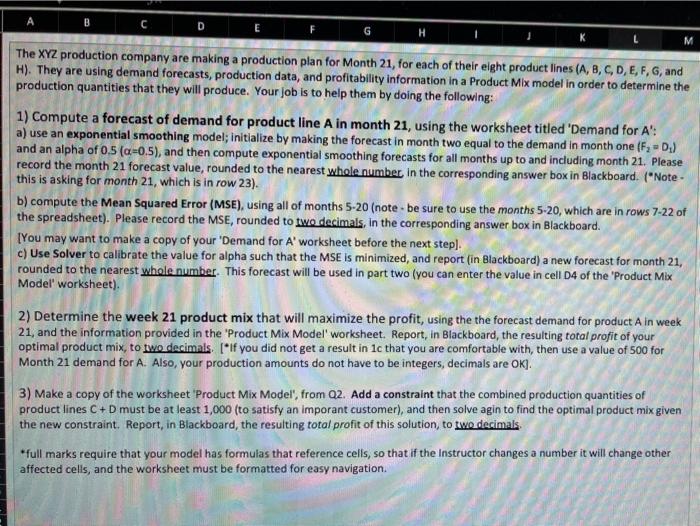
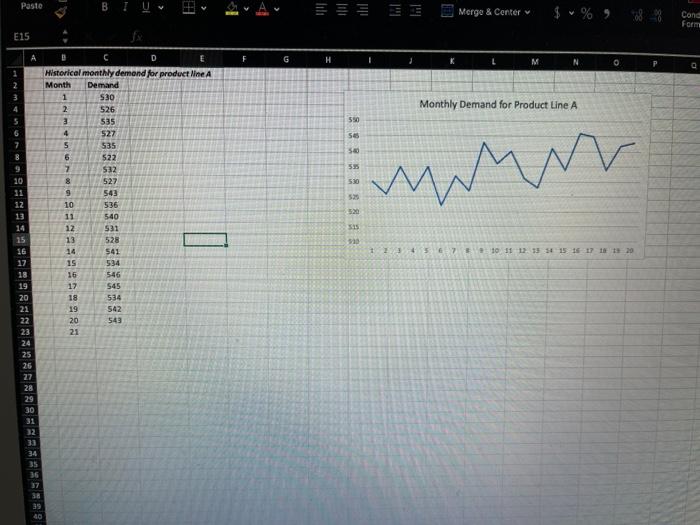
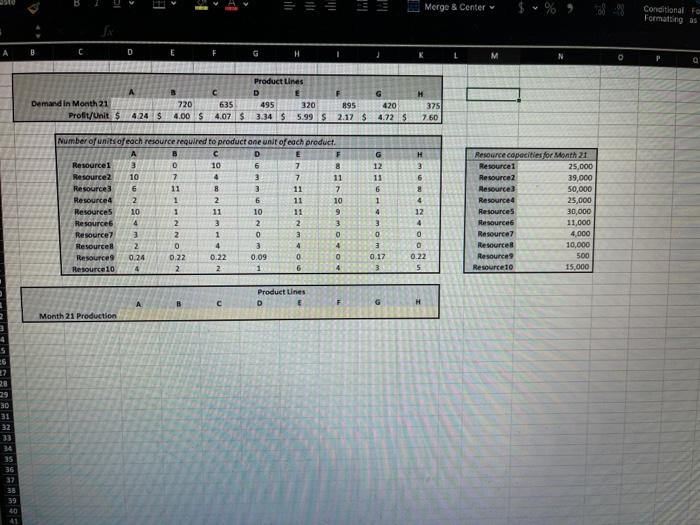
A B D G M The XYZ production company are making a production plan for Month 21, for each of their eight product lines (A, B, C, D, E, F, G, and H). They are using demand forecasts, production data, and profitability information in a Product Mix model in order to determine the production quantities that they will produce. Your job is to help them by doing the following: 1) Compute a forecast of demand for product line A in month 21, using the worksheet titled 'Demand for A': a) use an exponential smoothing model; Initialize by making the forecast in month two equal to the demand in month one (F, = D.) and an alpha of 0.5 (a=0.5), and then compute exponential smoothing forecasts for all months up to and including month 21. Please record the month 21 forecast value, rounded to the nearest whole number in the corresponding answer box in Blackboard. ("Note - this is asking for month 21, which is in row 23). b) compute the Mean Squared Error (MSE), using all of months 5-20 (note - be sure to use the months 5-20, which are in rows 7-22 of the spreadsheet). Please record the MSE, rounded to two decimals, in the corresponding answer box in Blackboard. [You may want to make a copy of your 'Demand for A' worksheet before the next step). c) Use Solver to calibrate the value for alpha such that the MSE is minimized, and report (in Blackboard) a new forecast for month 21, rounded to the nearest whole number. This forecast will be used in part two (you can enter the value in cell D4 of the Product Mix Model' worksheet) 2) Determine the week 21 product mix that will maximize the profit, using the the forecast demand for product A in week 21, and the information provided in the 'Product Mix Model' worksheet. Report, in Blackboard, the resulting total profit of your optimal product mix, to two decimals (*If you did not get a result in 1c that you are comfortable with, then use a value of 500 for Month 21 demand for A. Also, your production amounts do not have to be integers, decimals are OK). 3) Make a copy of the worksheet Product Mix Model', from 02. Add a constraint that the combined production quantities of product lines C + D must be at least 1,000 (to satisfy an imporant customer), and then solve agin to find the optimal product mix given the new constraint. Report, in Blackboard, the resulting total profit of this solution to two decimals full marks require that your model has formulas that reference cells, so that if the Instructor changes a number it will change other affected cells, and the worksheet must be formatted for easy navigation Paste e Merge & Center $ % Cond Form E15 A H L M Monthly Demand for Product Line A 550 56 530 10 11 12 B D E Historical monthly demand for product line A Month Demand 1 S30 2 526 3 535 4 527 S 535 6 522 7 532 527 9 543 10 536 11 540 12 531 13 528 14 541 15 534 16 546 17 545 18 534 19 542 20 543 21 BB & B / 30 2 3 4 5 6 7 10 11 12 15 15 16 17 18 20 14 15 16 17 18 19 20 21 22 23 24 25 26 27 28 29 30 31 32 34 35 36 37 38 39 Merge & Center Conditional Fan Formatting as D H M 0 Q A 635 4.24 $ 4.00 $ 4.07 S Demand in Month 21 Profit/Unit $ 720 Product Lines D 495 320 3.34 $ 5.99 $ 895420 375 2.17 $4.72 5 7.60 G 12 11 H 3 6 Number of units of each resource required to product one unit of each product Resources 3 D 10 6 7 Resource2 10 7 4 3 7 11 Resource 6 11 8 3 11 7 Resources 2 1 2 11 10 Resources 10 1 10 11 9 Resource 4 2 3 2 3 Resource 3 2 1 3 0 Resources 0 4 3 4 4 Resource 0.24 0.22 0.22 0.09 0 0 Resource 10 4 2 2 1 6 4 om NO 6 1 4 3 4 12 4 0 0 0.22 5 Resource capacities for Month 21 Resource 25,000 Resource2 39,000 Resources 50,000 Resource 25,000 Resources 30,000 Resources 11,000 Resource 4.000 Resources 10,000 Resource 500 Resource 10 15.000 3 0.17 3 Product Lines D E G Month 21 Production 26 28 29 30 31 32 33 34 5 36 37 38 39 20 A B D G M The XYZ production company are making a production plan for Month 21, for each of their eight product lines (A, B, C, D, E, F, G, and H). They are using demand forecasts, production data, and profitability information in a Product Mix model in order to determine the production quantities that they will produce. Your job is to help them by doing the following: 1) Compute a forecast of demand for product line A in month 21, using the worksheet titled 'Demand for A': a) use an exponential smoothing model; Initialize by making the forecast in month two equal to the demand in month one (F, = D.) and an alpha of 0.5 (a=0.5), and then compute exponential smoothing forecasts for all months up to and including month 21. Please record the month 21 forecast value, rounded to the nearest whole number in the corresponding answer box in Blackboard. ("Note - this is asking for month 21, which is in row 23). b) compute the Mean Squared Error (MSE), using all of months 5-20 (note - be sure to use the months 5-20, which are in rows 7-22 of the spreadsheet). Please record the MSE, rounded to two decimals, in the corresponding answer box in Blackboard. [You may want to make a copy of your 'Demand for A' worksheet before the next step). c) Use Solver to calibrate the value for alpha such that the MSE is minimized, and report (in Blackboard) a new forecast for month 21, rounded to the nearest whole number. This forecast will be used in part two (you can enter the value in cell D4 of the Product Mix Model' worksheet) 2) Determine the week 21 product mix that will maximize the profit, using the the forecast demand for product A in week 21, and the information provided in the 'Product Mix Model' worksheet. Report, in Blackboard, the resulting total profit of your optimal product mix, to two decimals (*If you did not get a result in 1c that you are comfortable with, then use a value of 500 for Month 21 demand for A. Also, your production amounts do not have to be integers, decimals are OK). 3) Make a copy of the worksheet Product Mix Model', from 02. Add a constraint that the combined production quantities of product lines C + D must be at least 1,000 (to satisfy an imporant customer), and then solve agin to find the optimal product mix given the new constraint. Report, in Blackboard, the resulting total profit of this solution to two decimals full marks require that your model has formulas that reference cells, so that if the Instructor changes a number it will change other affected cells, and the worksheet must be formatted for easy navigation Paste e Merge & Center $ % Cond Form E15 A H L M Monthly Demand for Product Line A 550 56 530 10 11 12 B D E Historical monthly demand for product line A Month Demand 1 S30 2 526 3 535 4 527 S 535 6 522 7 532 527 9 543 10 536 11 540 12 531 13 528 14 541 15 534 16 546 17 545 18 534 19 542 20 543 21 BB & B / 30 2 3 4 5 6 7 10 11 12 15 15 16 17 18 20 14 15 16 17 18 19 20 21 22 23 24 25 26 27 28 29 30 31 32 34 35 36 37 38 39 Merge & Center Conditional Fan Formatting as D H M 0 Q A 635 4.24 $ 4.00 $ 4.07 S Demand in Month 21 Profit/Unit $ 720 Product Lines D 495 320 3.34 $ 5.99 $ 895420 375 2.17 $4.72 5 7.60 G 12 11 H 3 6 Number of units of each resource required to product one unit of each product Resources 3 D 10 6 7 Resource2 10 7 4 3 7 11 Resource 6 11 8 3 11 7 Resources 2 1 2 11 10 Resources 10 1 10 11 9 Resource 4 2 3 2 3 Resource 3 2 1 3 0 Resources 0 4 3 4 4 Resource 0.24 0.22 0.22 0.09 0 0 Resource 10 4 2 2 1 6 4 om NO 6 1 4 3 4 12 4 0 0 0.22 5 Resource capacities for Month 21 Resource 25,000 Resource2 39,000 Resources 50,000 Resource 25,000 Resources 30,000 Resources 11,000 Resource 4.000 Resources 10,000 Resource 500 Resource 10 15.000 3 0.17 3 Product Lines D E G Month 21 Production 26 28 29 30 31 32 33 34 5 36 37 38 39 20
Step by Step Solution
There are 3 Steps involved in it

Get step-by-step solutions from verified subject matter experts