Question: Please help solve Demand Analysis Calculating Market Demand The Industry Demand Analysis will help the Marketing and Production Departments understand future demand. Marketing can use
Please help solve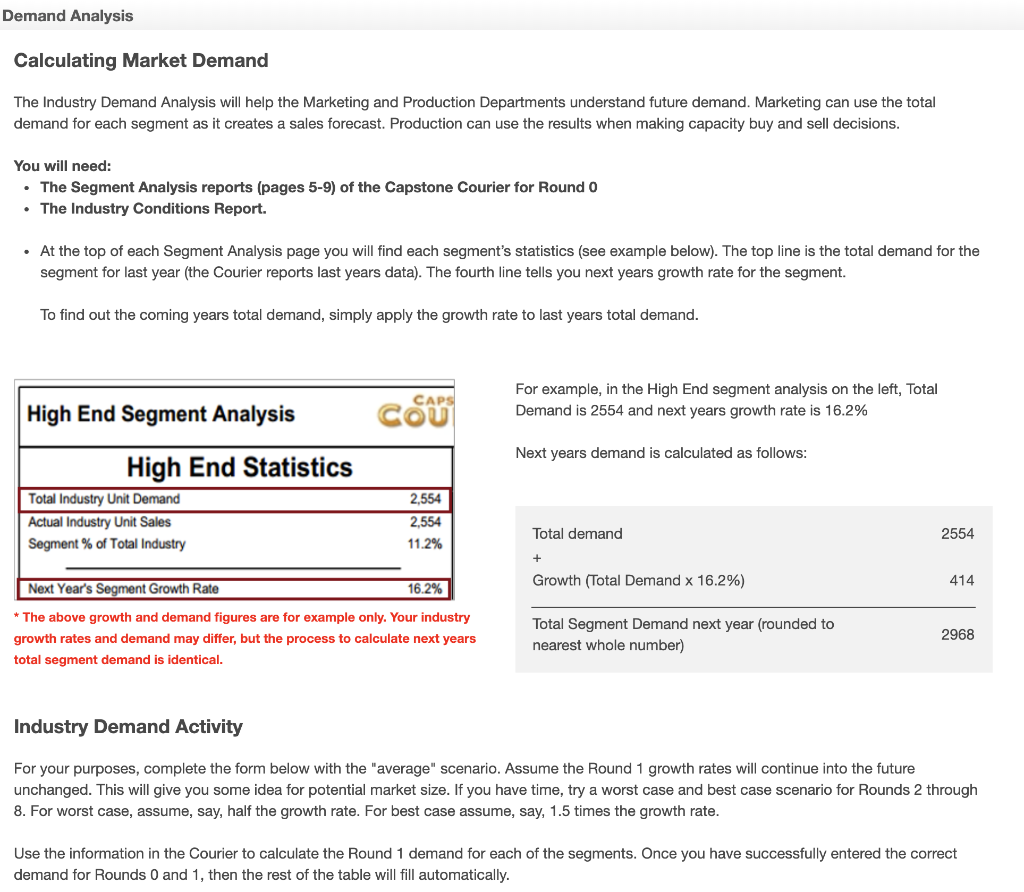
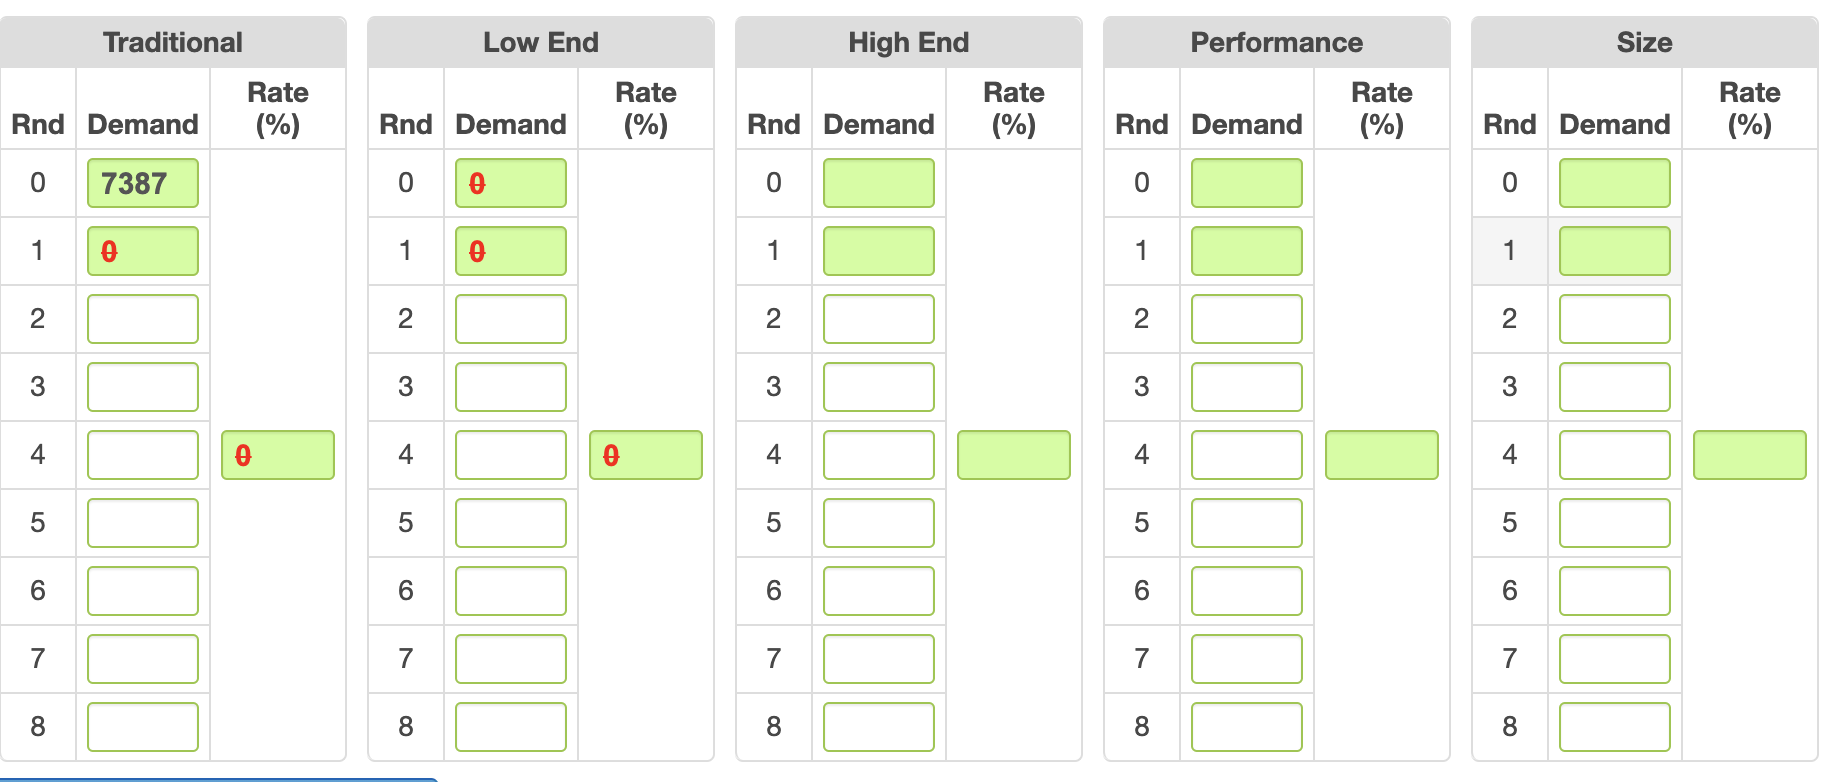
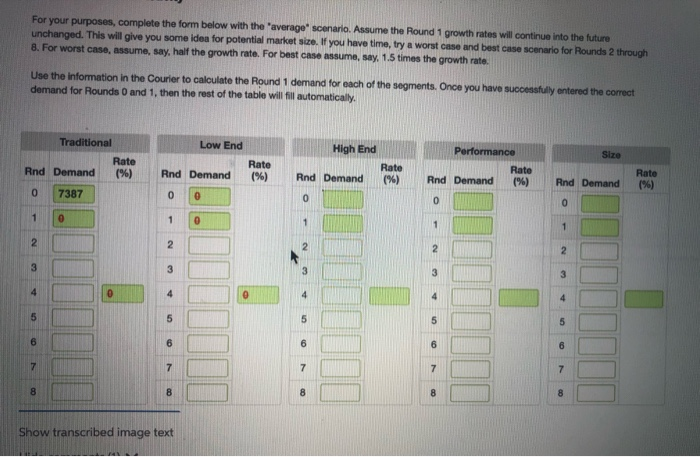
Demand Analysis Calculating Market Demand The Industry Demand Analysis will help the Marketing and Production Departments understand future demand. Marketing can use the total demand for each segment as it creates a sales forecast. Production can use the results when making capacity buy and sell decisions. You will need: The Segment Analysis reports (pages 5-9) of the Capstone Courier for Round O The Industry Conditions Report. At the top of each Segment Analysis page you will find each segment's statistics (see example below). The top line is the total demand for the segment for last year (the Courier reports last years data). The fourth line tells you next years growth rate for the segment. To find out the coming years total demand, simply apply the growth rate to last years total demand. For example, in the High End segment analysis on the left, Total Demand is 2554 and next years growth rate is 16.2% High End Segment Analysis Next years demand is calculated as follows: High End Statistics Total Industry Unit Demand Actual Industry Unit Sales Segment % of Total Industry 2,554 2,554 11.2% Total demand 2554 Growth (Total Demand x 16.2%) 414 Next Year's Segment Growth Rate 16.2% * The above growth and demand figures are for example only. Your industry growth rates and demand may differ, but the process to calculate next years total segment demand is identical. Total Segment Demand next year (rounded to nearest whole number) 2968 Industry Demand Activity For your purposes, complete the form below with the "average" scenario. Assume the Round 1 growth rates will continue into the future unchanged. This will give you some idea for potential market size. If you have time, try a worst case and best case scenario for Rounds 2 through 8. For worst case, assume, say, half the growth rate. For best case assume, say, 1.5 times the growth rate. Use the information in the Courier to calculate the Round 1 demand for each of the segments. Once you have successfully entered the correct demand for Rounds 0 and 1, then the rest of the table will fill automatically. Traditional Low End Size Rate (%) High End Rate Rnd Demand (%) Rate Performance Rate Rnd Demand Rate (%) Rnd Demand Rnd Demand (%) Rnd Demand o 7387 1 For your purposes, complete the form below with the average scenario. Assume the Round 1 growth rates will continue into the future unchanged. This will give you some idea for potential market size. If you have time, try a worst one and best case scenario for Rounds 2 through 8. For worst case, assume, say, half the growth rate. For best case assume, say, 1.5 times the growth rate Use the information in the Courier to calculate the Round 1 demand for each of the segments. Once you have successfully entered the correct demand for Rounds 0 and 1, then the rest of the table will fill automatically. Low End Traditional Rate Rnd Demand (%) High End Rate Rnd Demand (%) Rate (%) Rnd Demand Rnd Demand (%) Rate (%) Rnd Demand 7387 Show transcribed image text